
ATMS 111 - Prof. Douglas K. Miller
Understanding the Atmosphere - Laboratory Section
AMS author reference/citation guide
Laboratory#1 - The Sun
Preparatory exercises for Lab#1
sample Excel plot
Laboratory#2 - Air Temperature
Preparatory exercises for Lab#2
700 mb map (for isotherm analysis)
sample isotherm analysis
Laboratory#3 - Humidity
Preparatory exercises for Lab#3
sample Excel plot
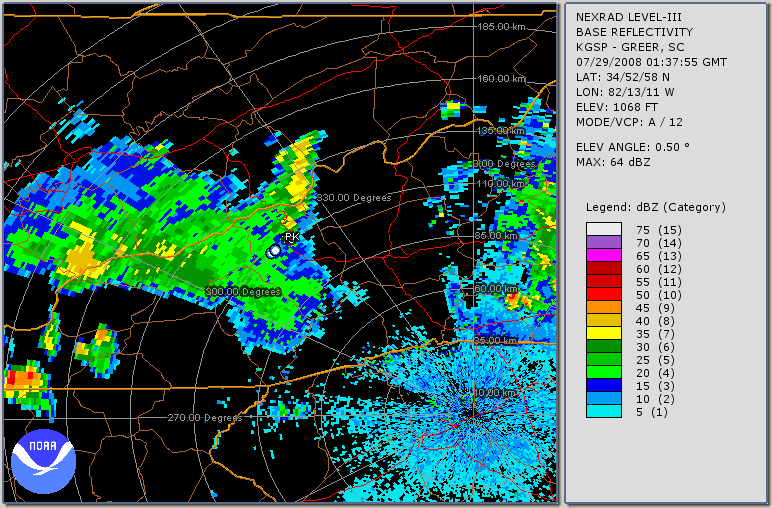
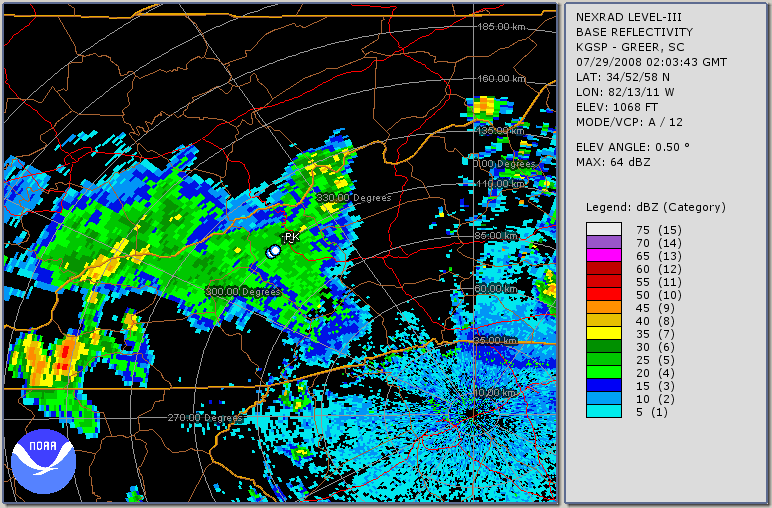
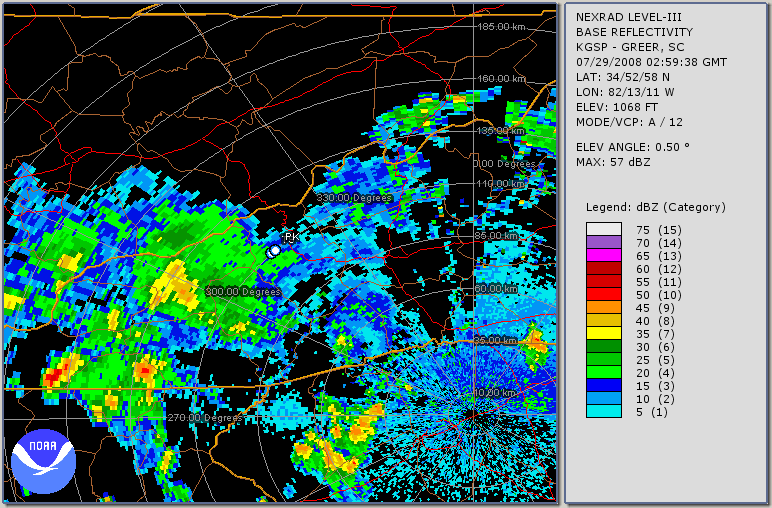
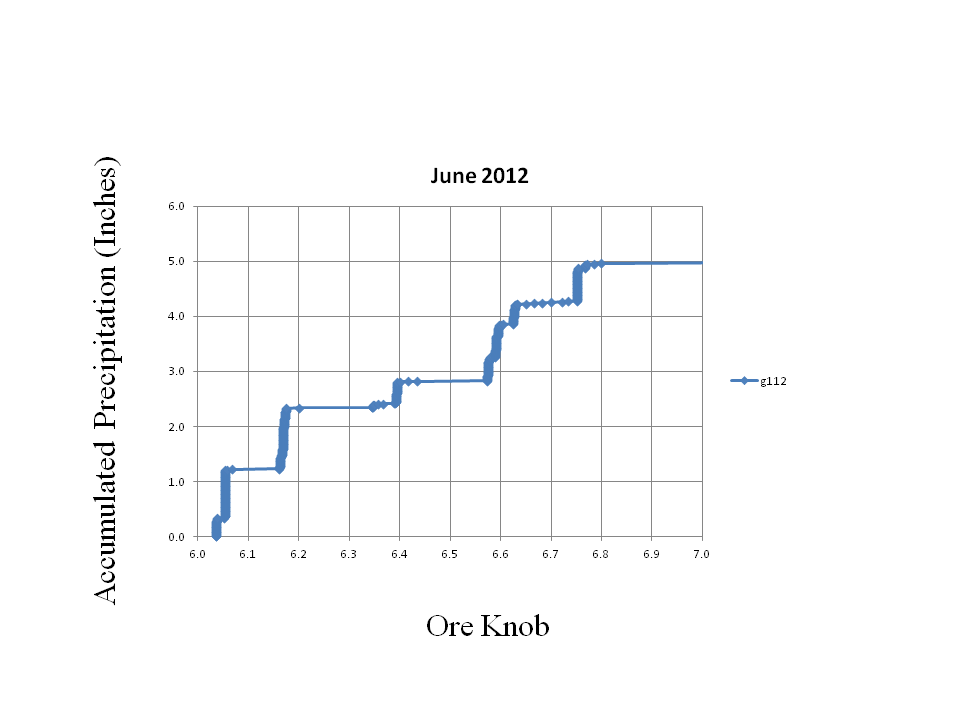
Laboratory#4 - Precipitation
Preparatory exercises for Lab#4
sample Excel plot
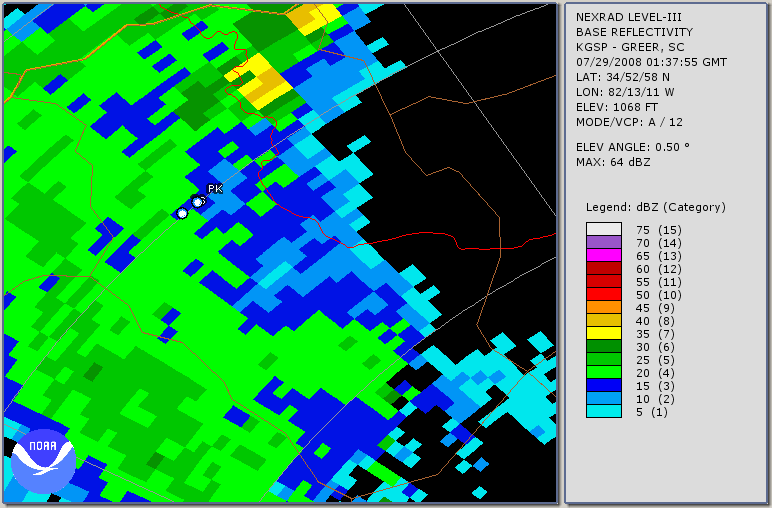
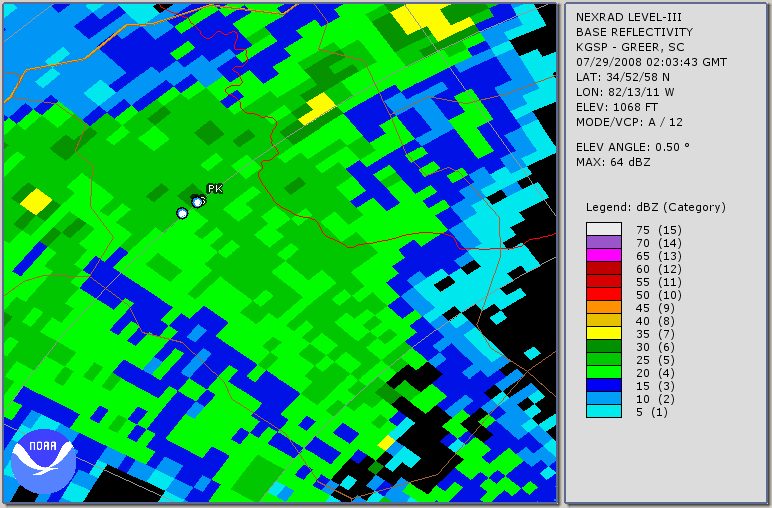
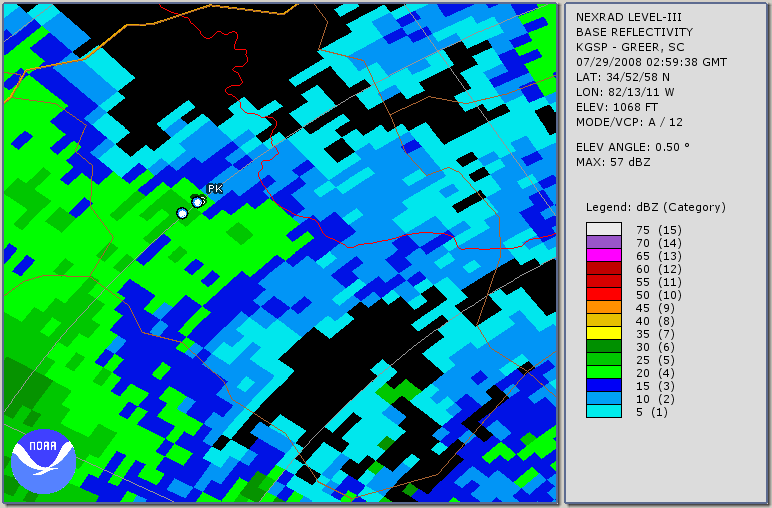
zoomed images - radar P1, radar P2, radar P3
"big picture" images - radar P1, radar P2, radar P3
radar references; video#1 (look at 2:00 mark), static (Clemson Univ.)
actual observations from a tipping bucket gauge in Haywood County
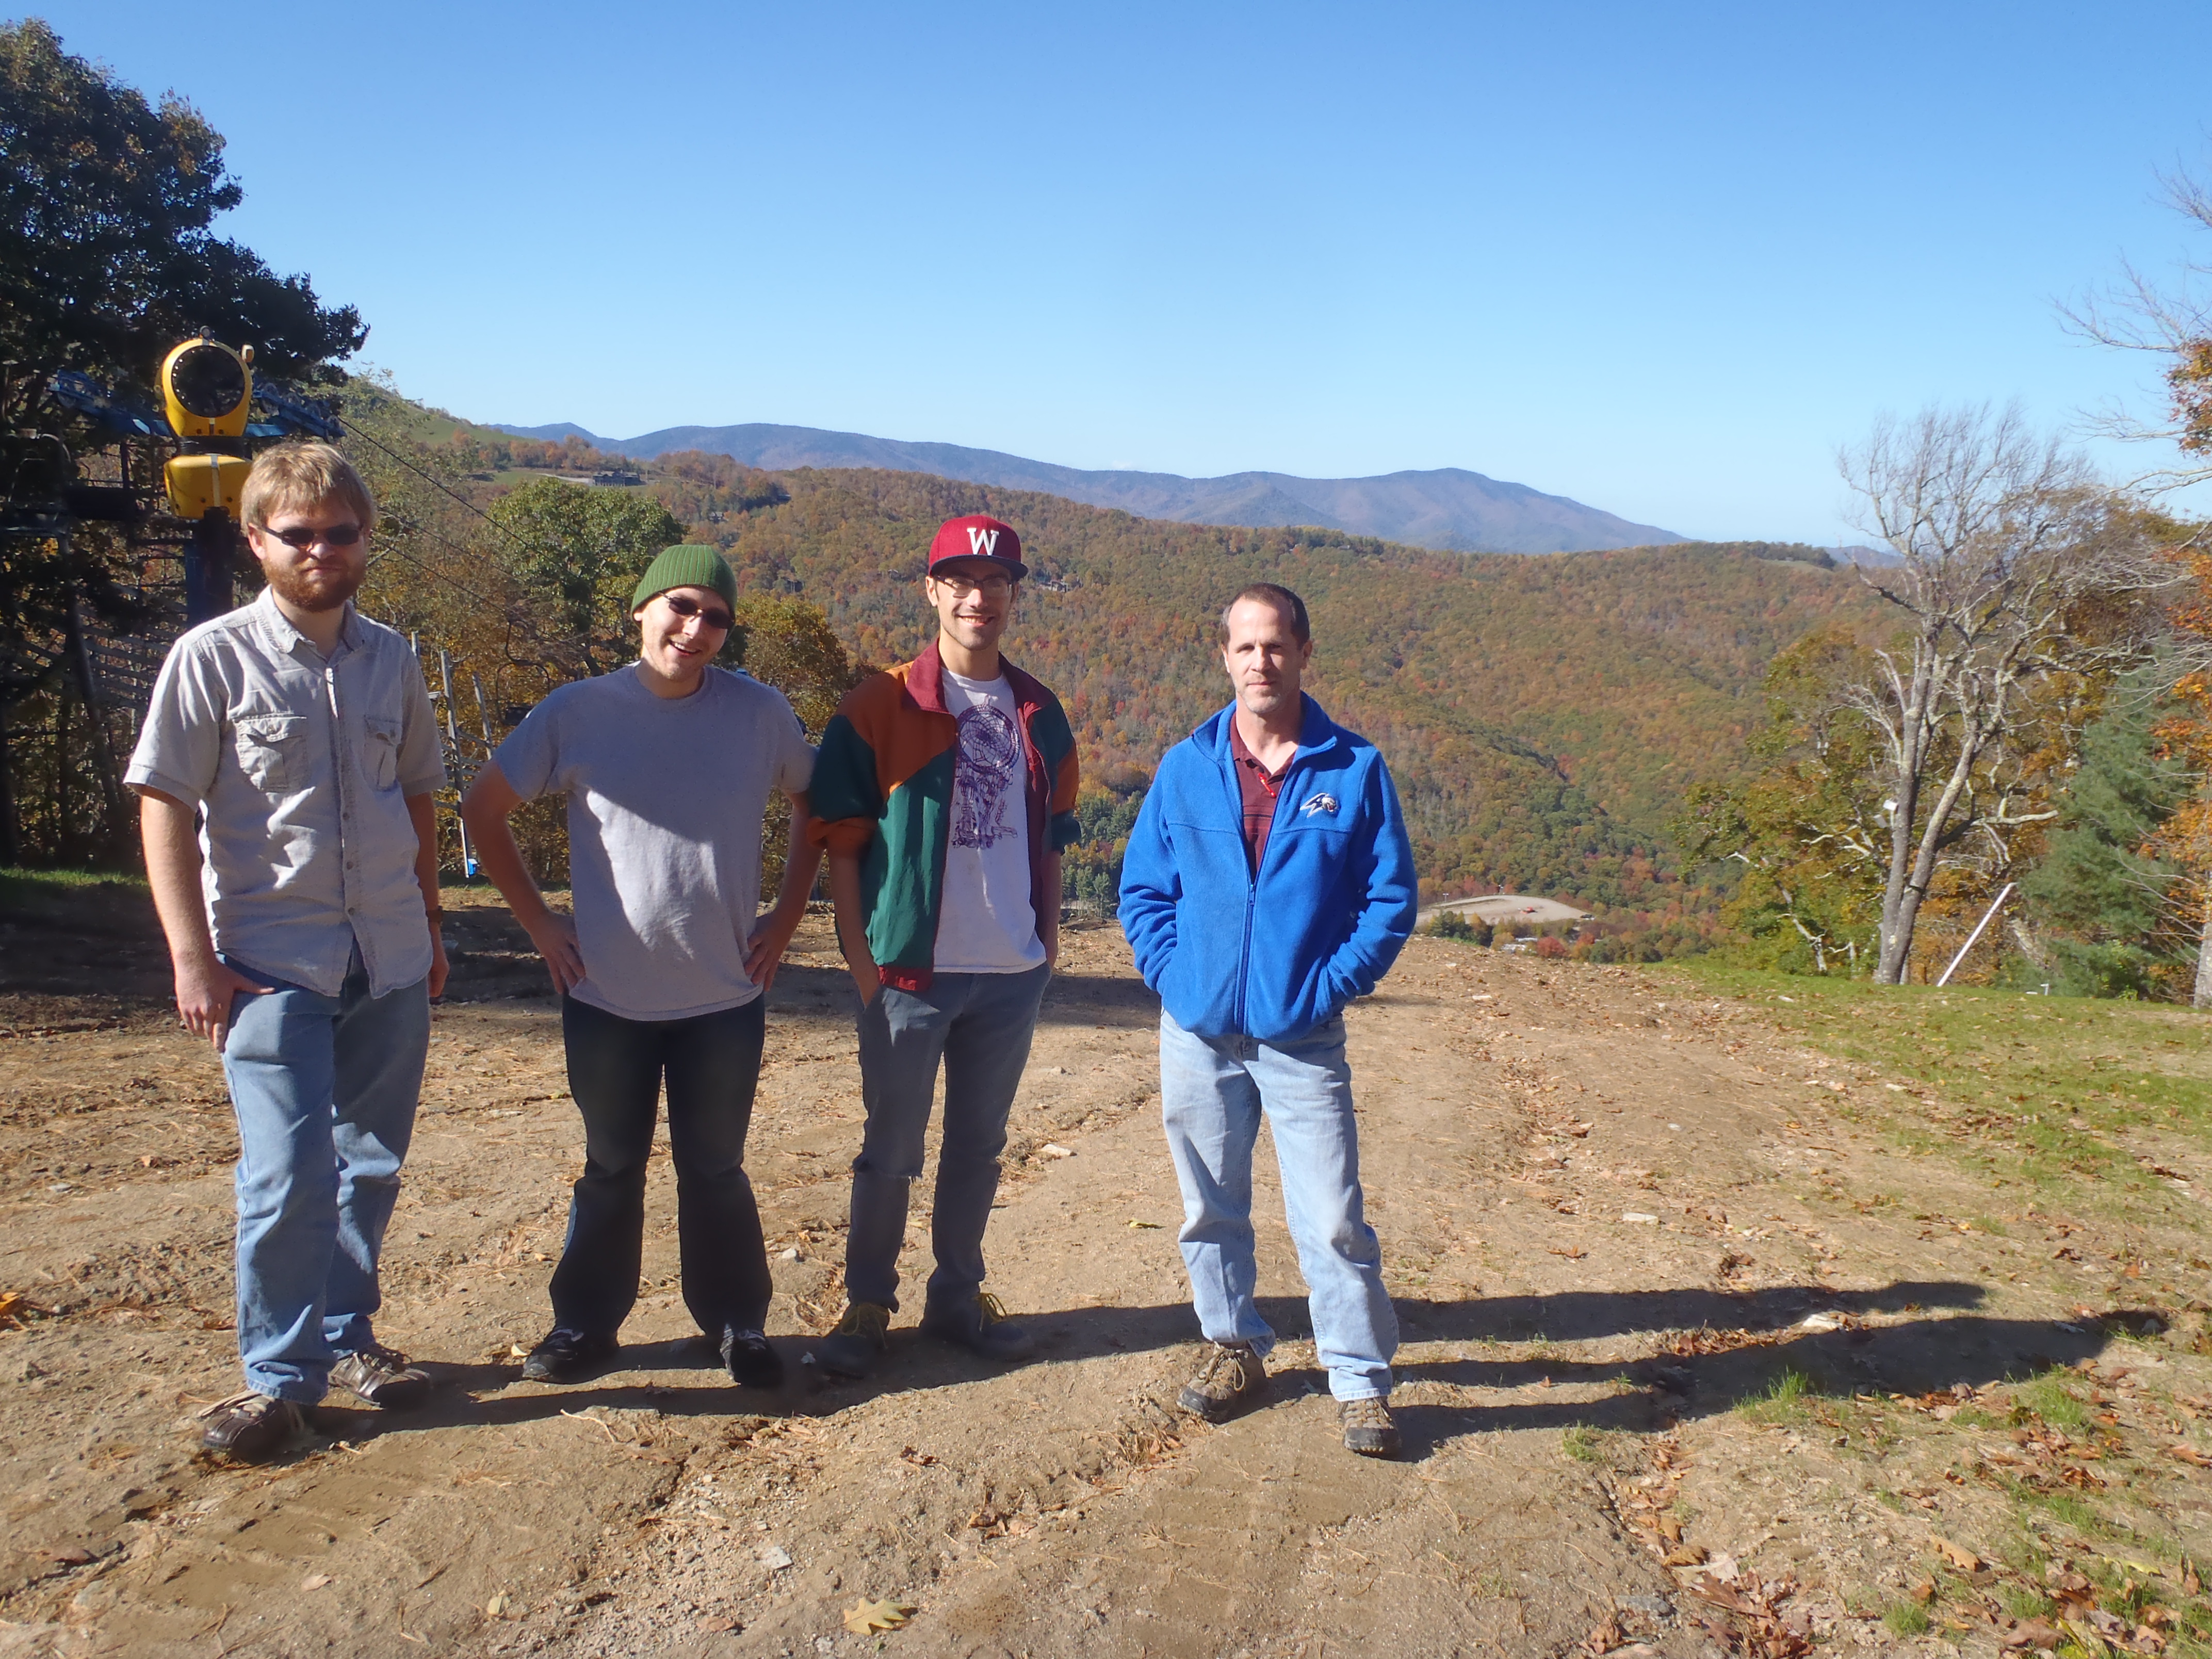
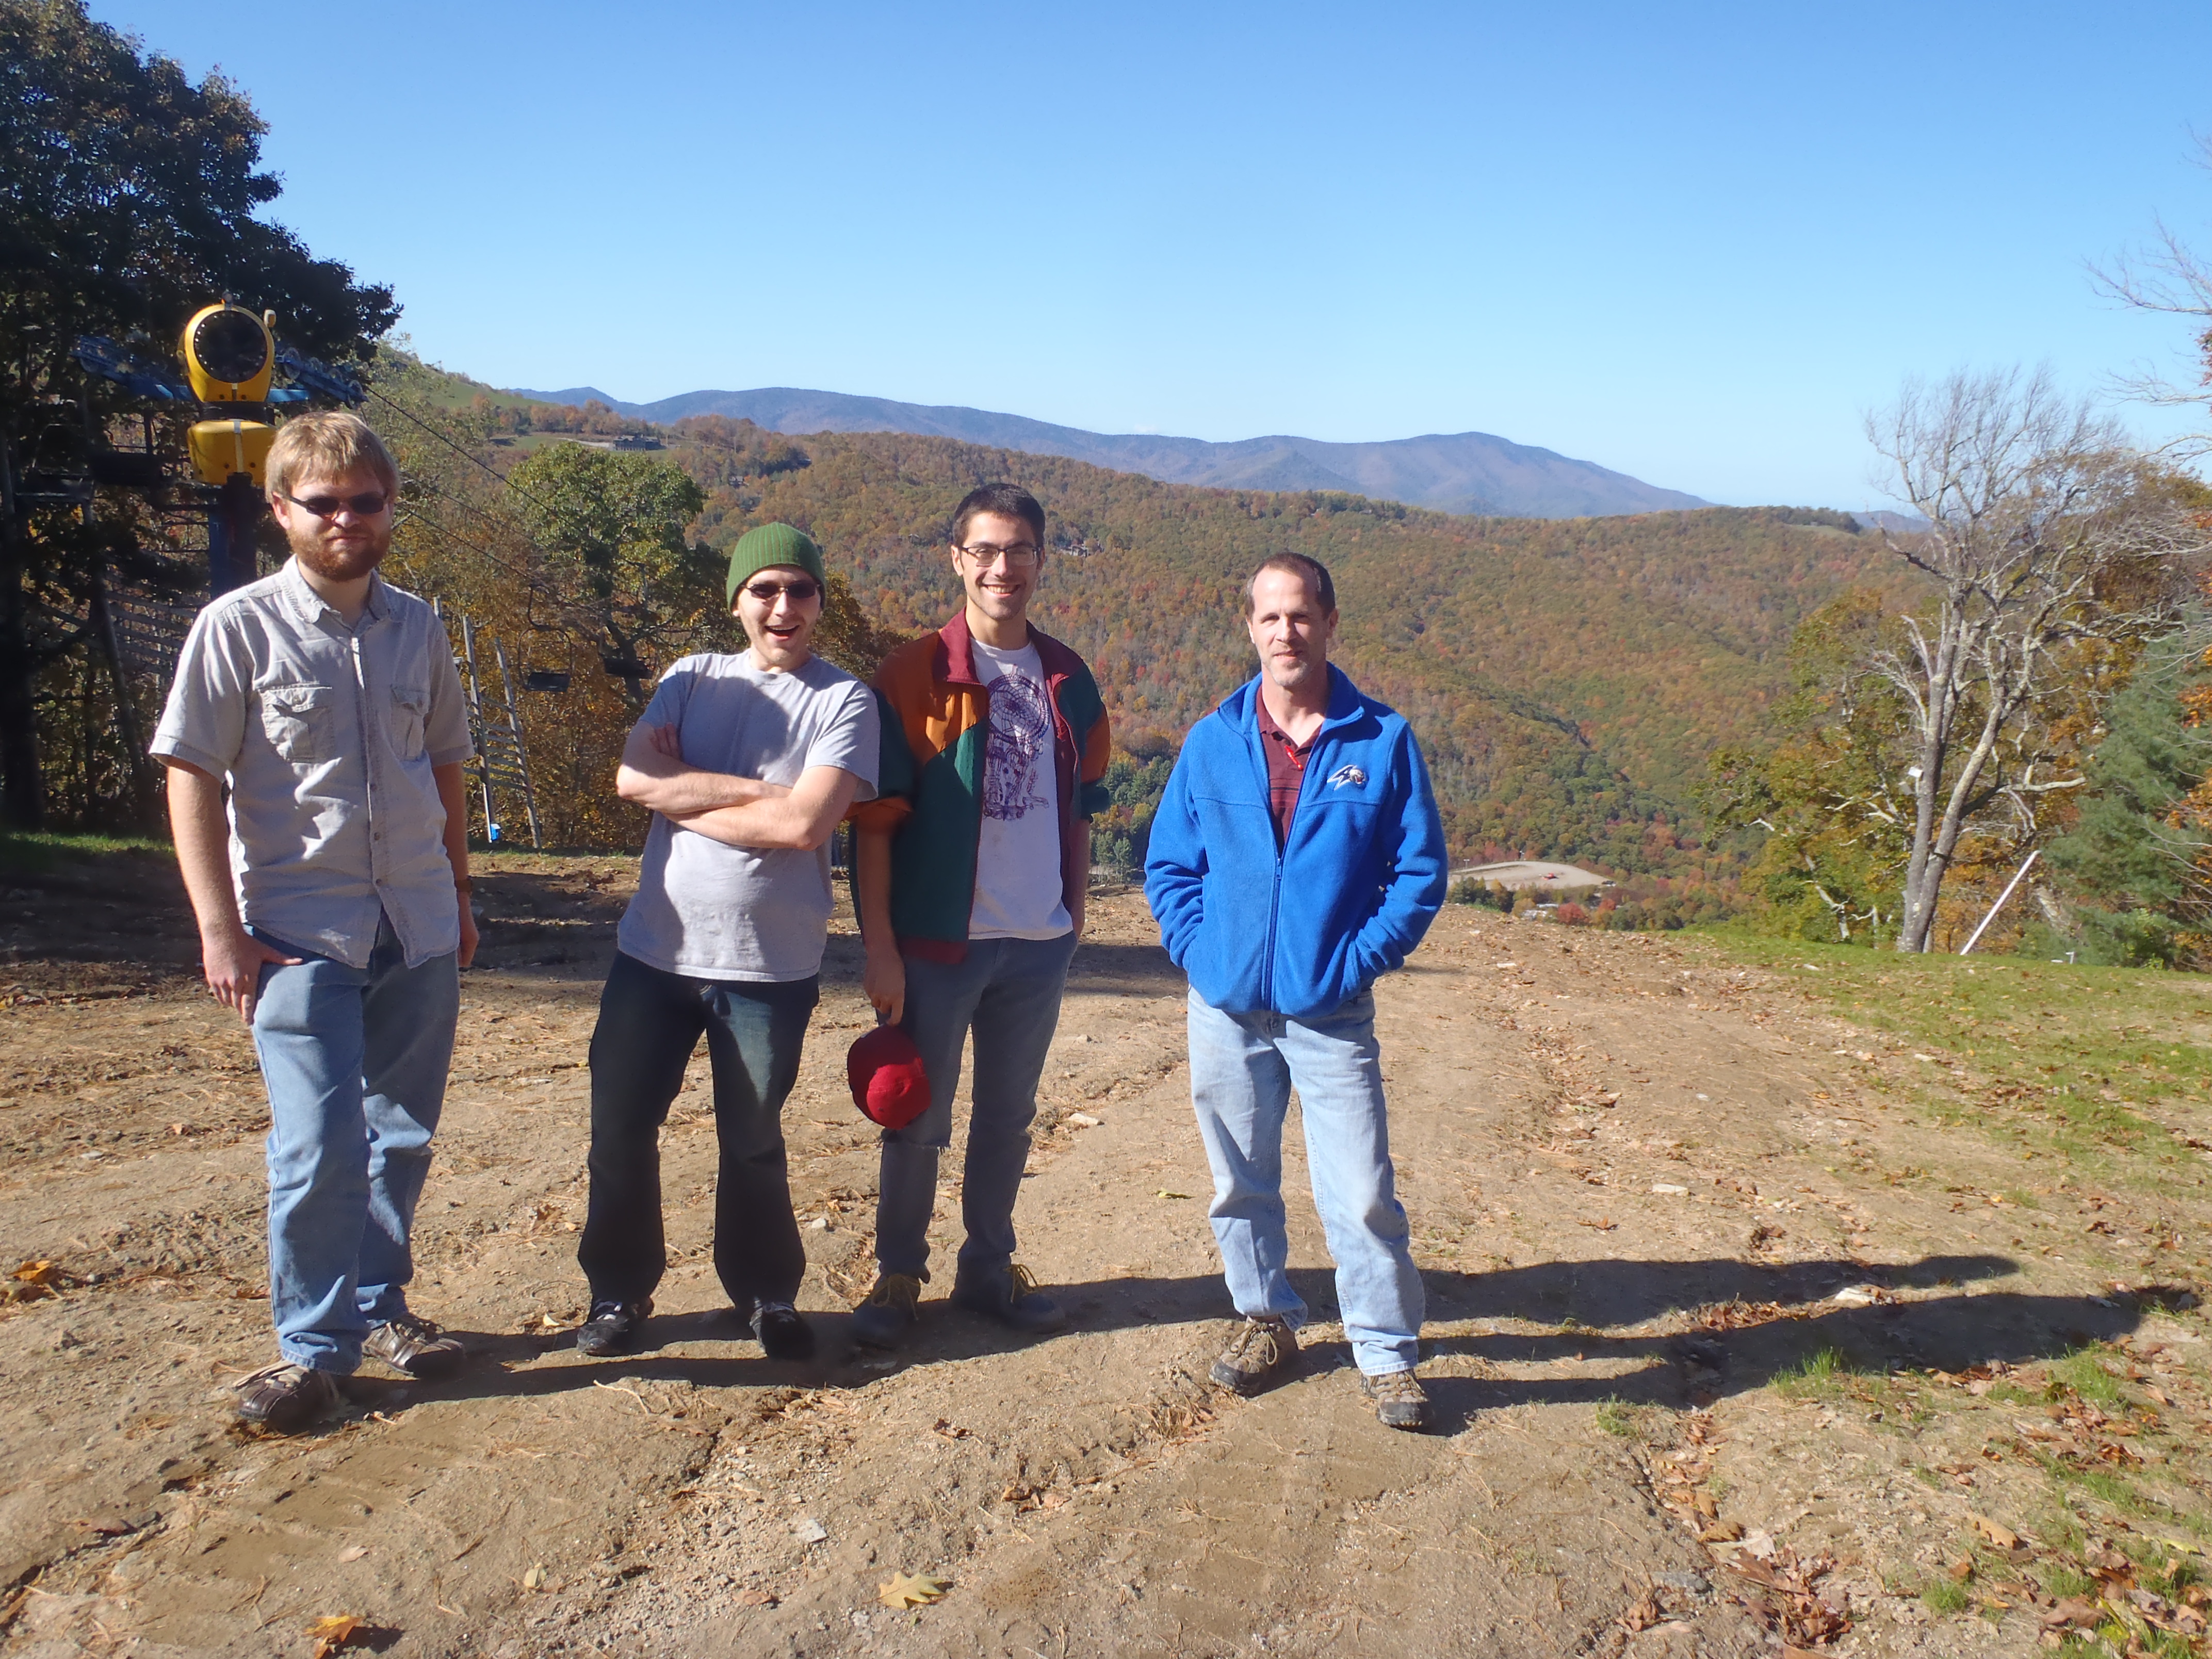
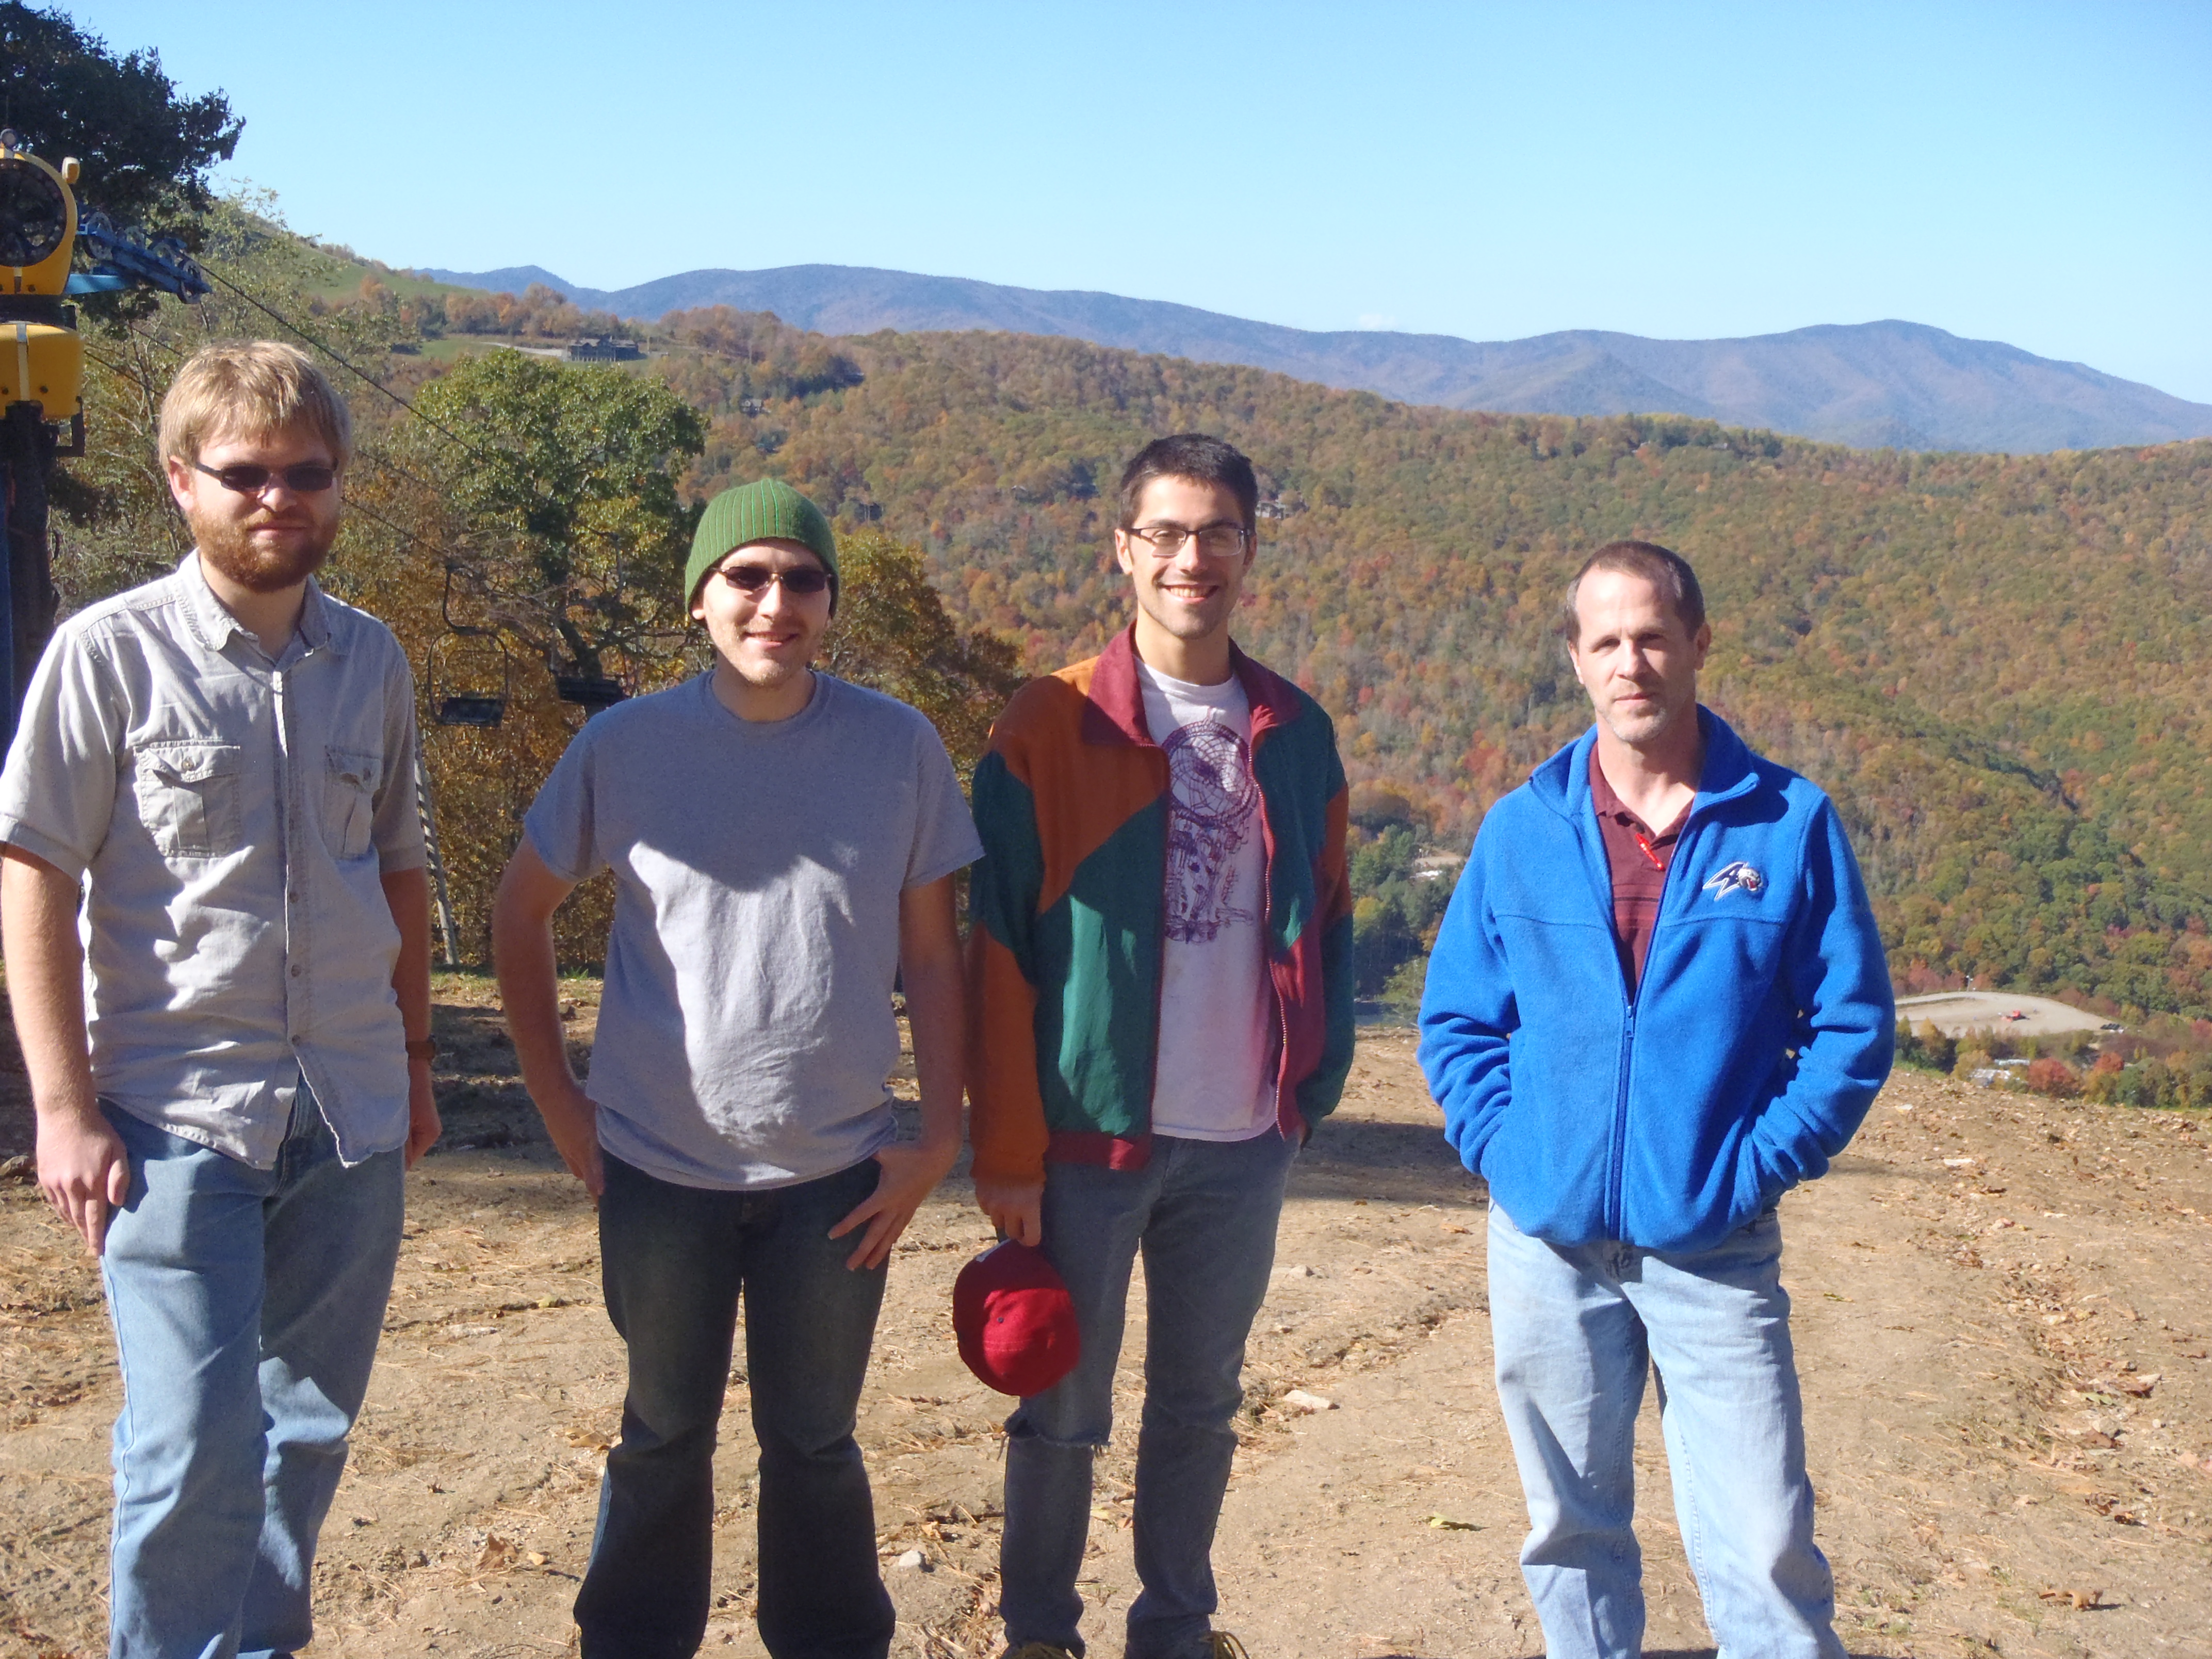
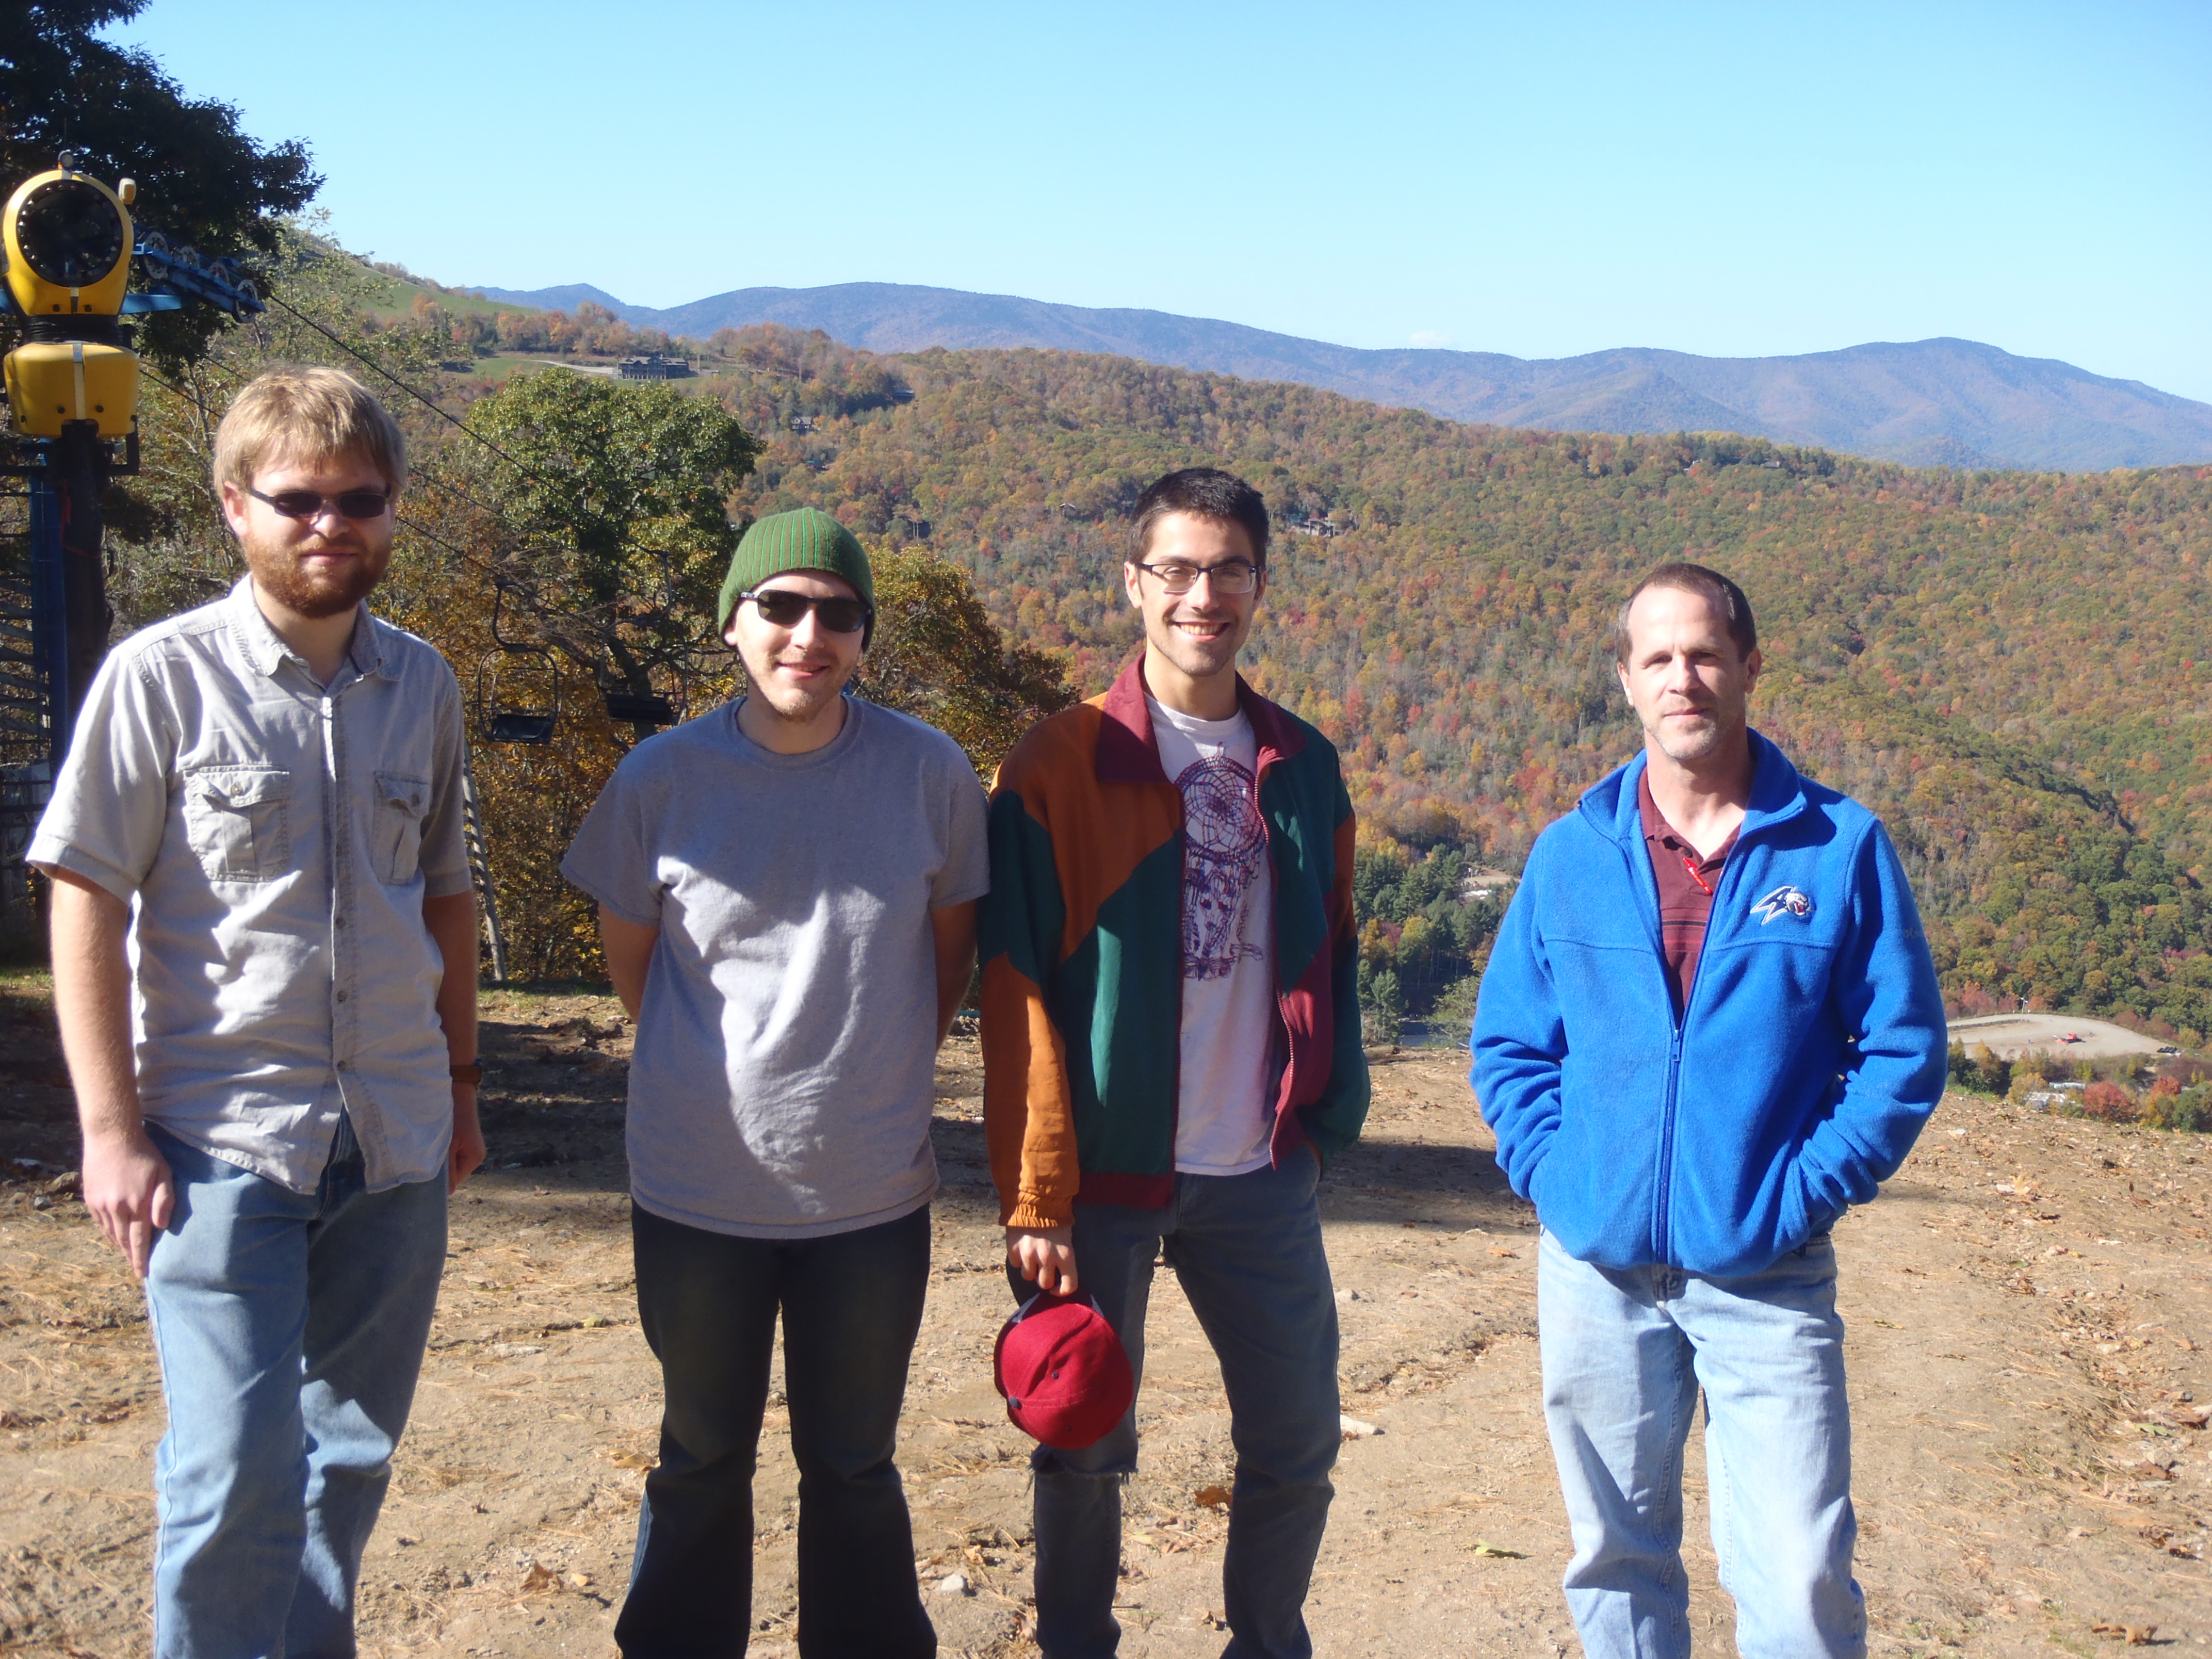
Ski Cataloochee gauge visit photographs - pic #1, pic #2, pic #3, pic #4
Laboratory#5 - Wind
Preparatory exercises for Lab#5
Laboratory#6 - Air Pressure
Preparatory exercises for Lab#6
sample Excel plot
Mean sea level pressure map (for isobar analysis)
sample isobar analysis
Reflective Evaluation (final exam period)
----------------------------------------------------
Miscellaneous weather-related web links
NOAA National Hurricane Center
NOAA Weather Prediction Center
Questions? contact dmiller at unca.edu