Comparison of temporal interpolation techniques for NARR data |
|
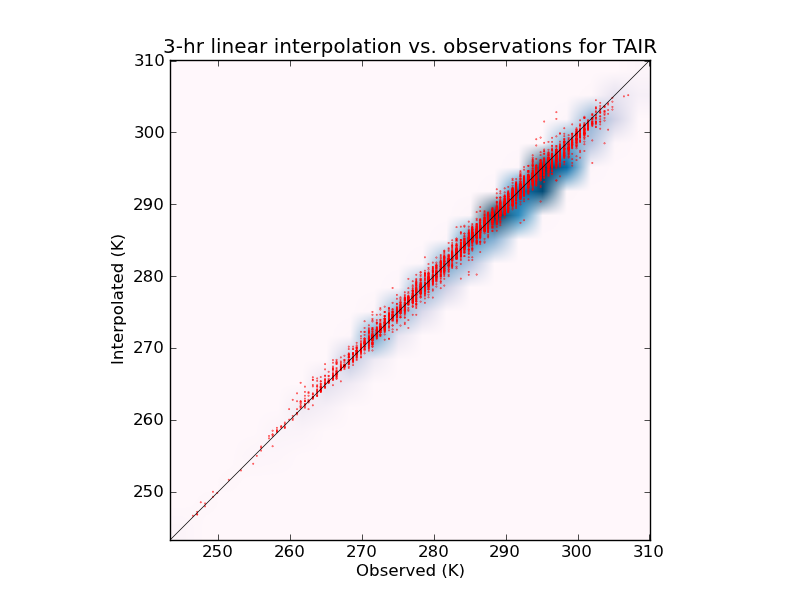
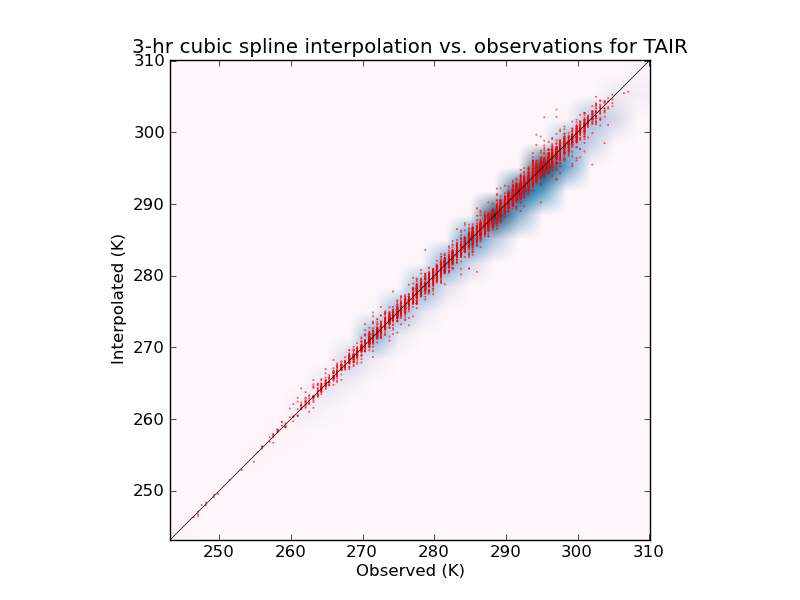
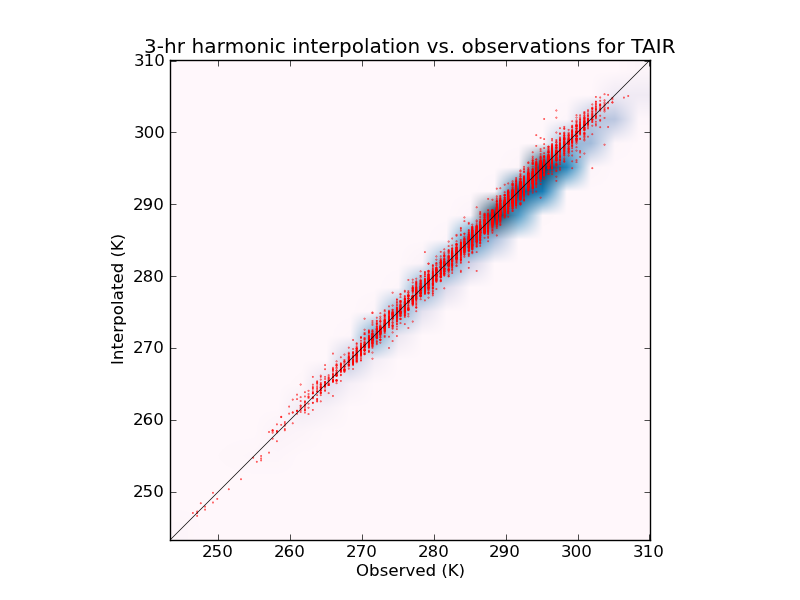
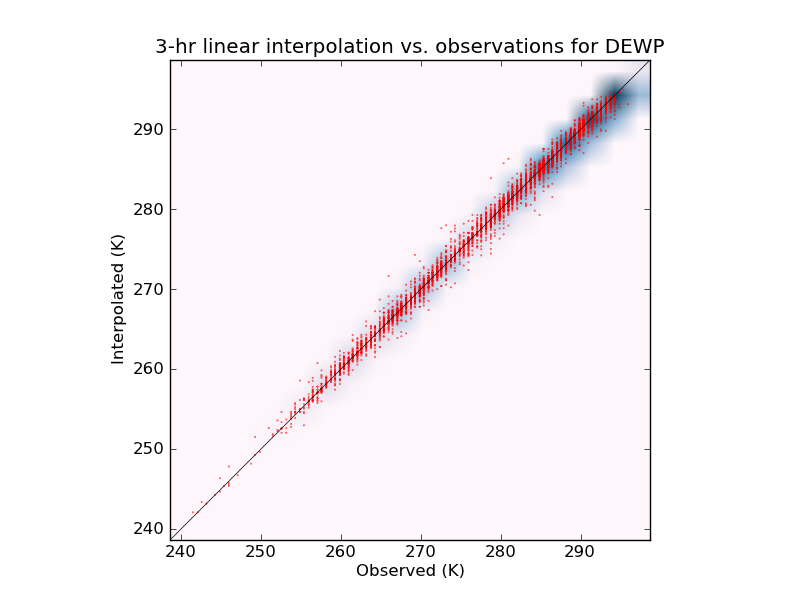
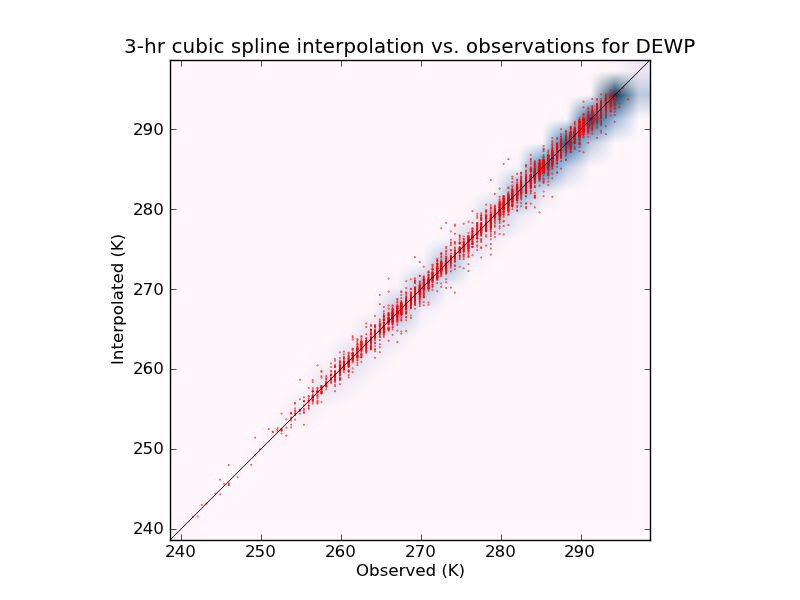
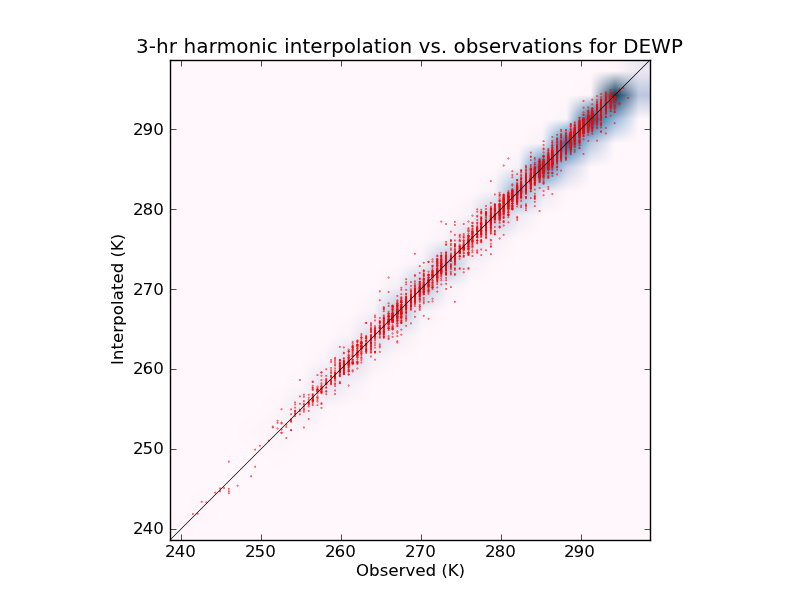
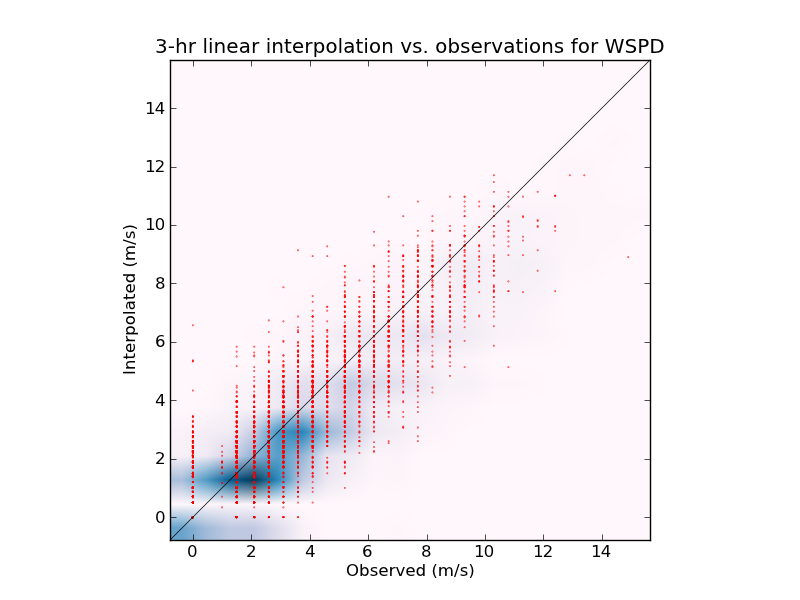
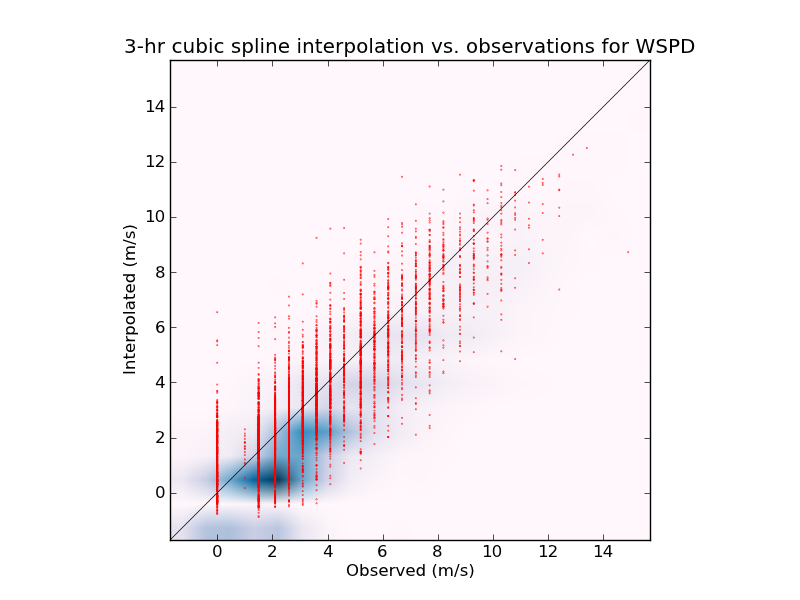
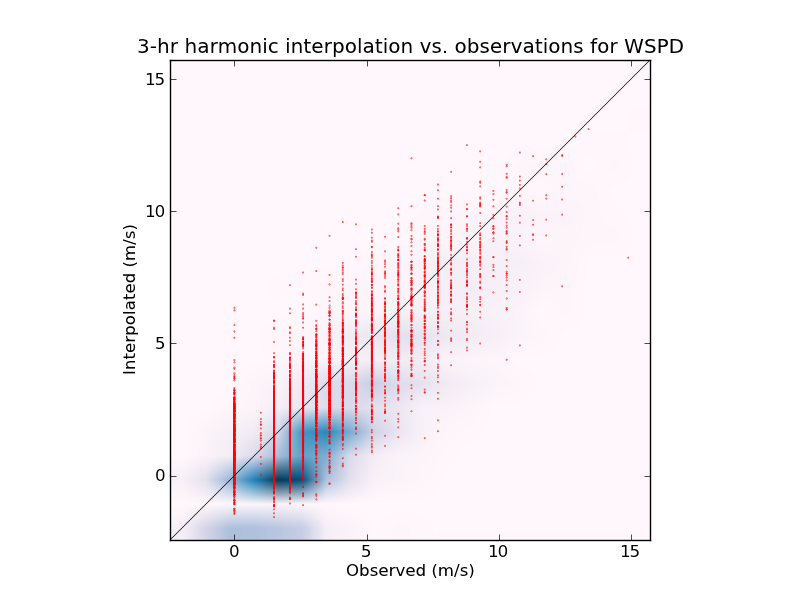
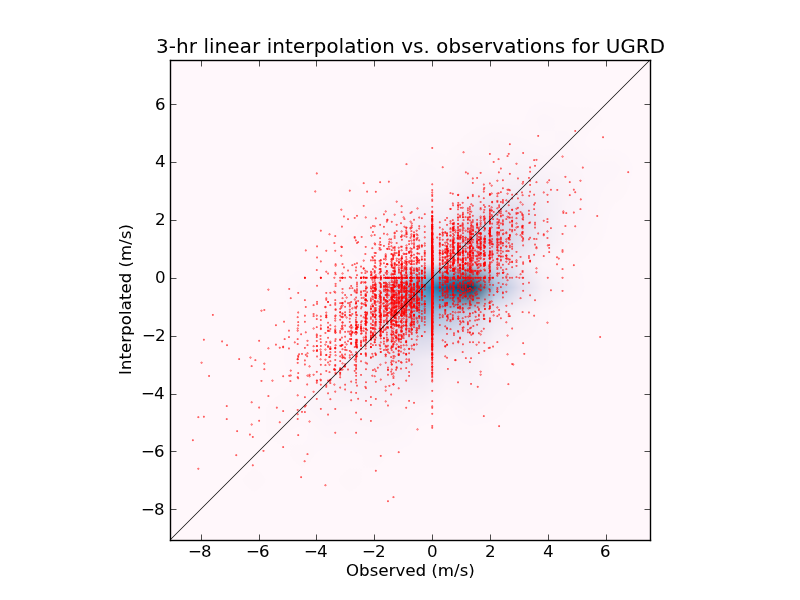
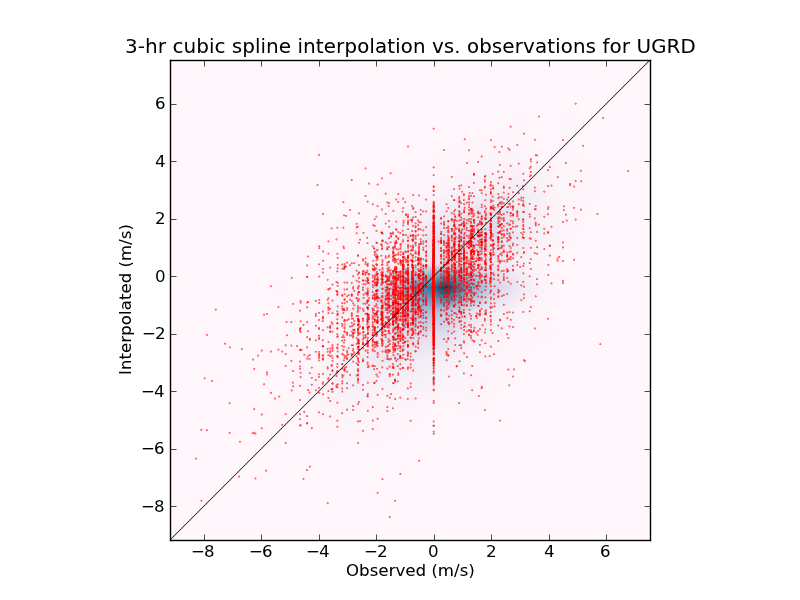
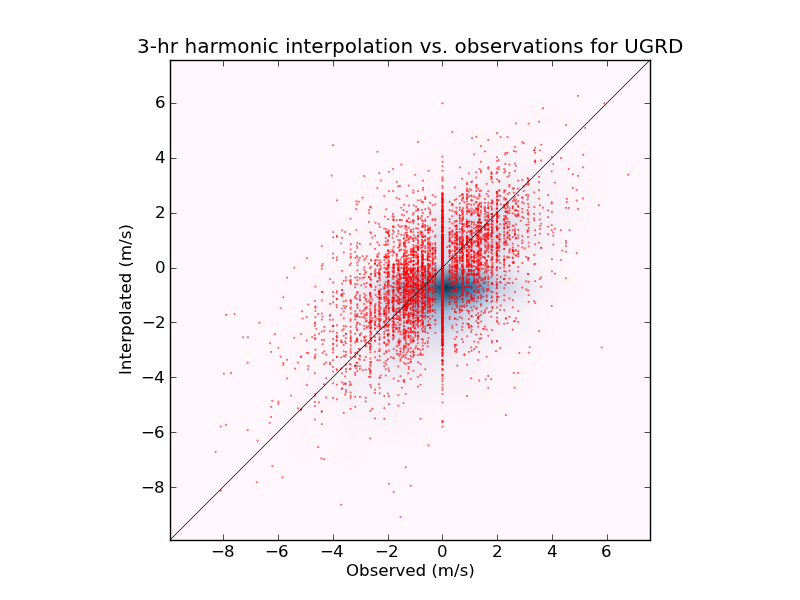
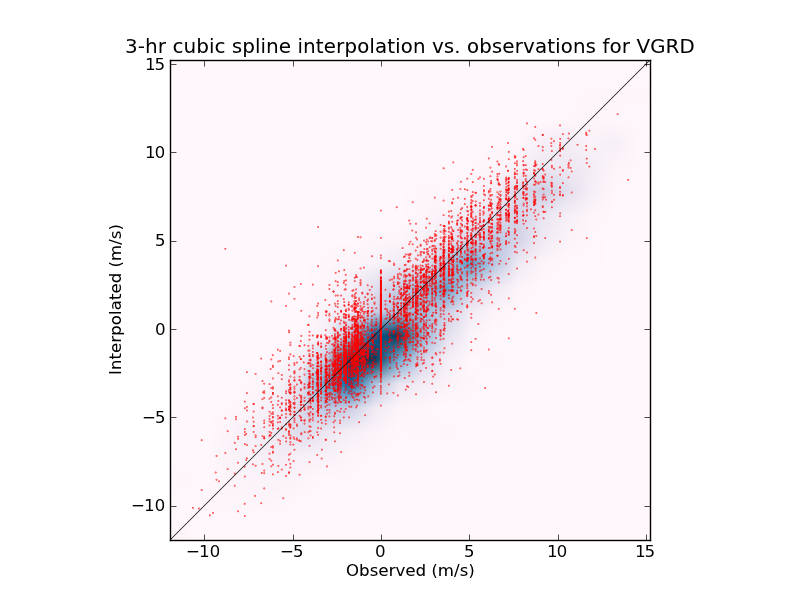
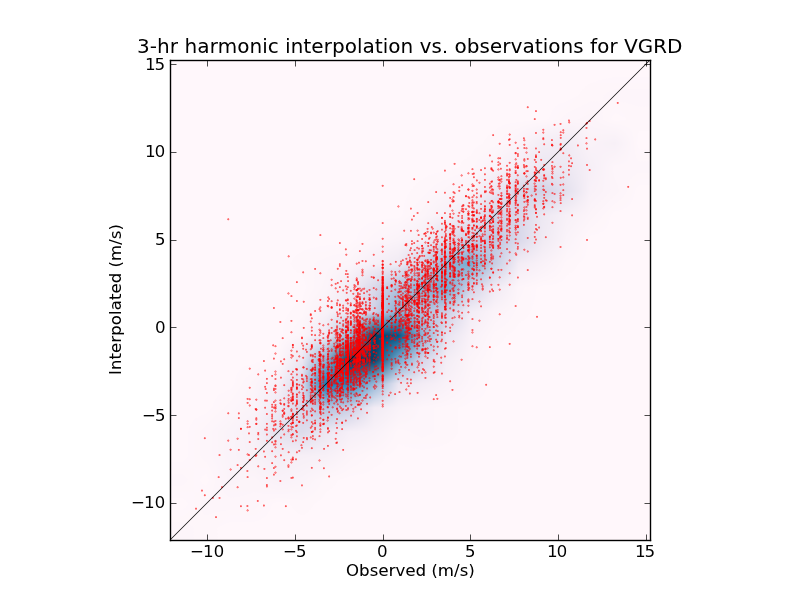
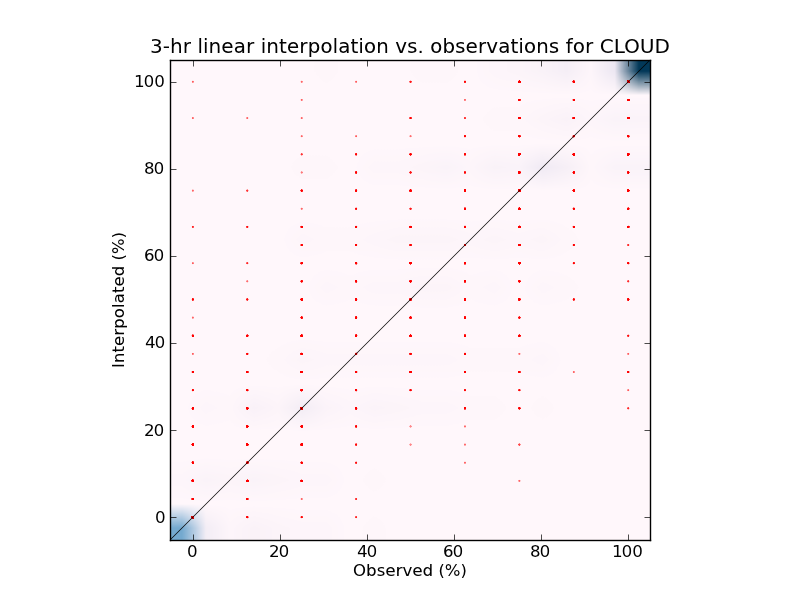
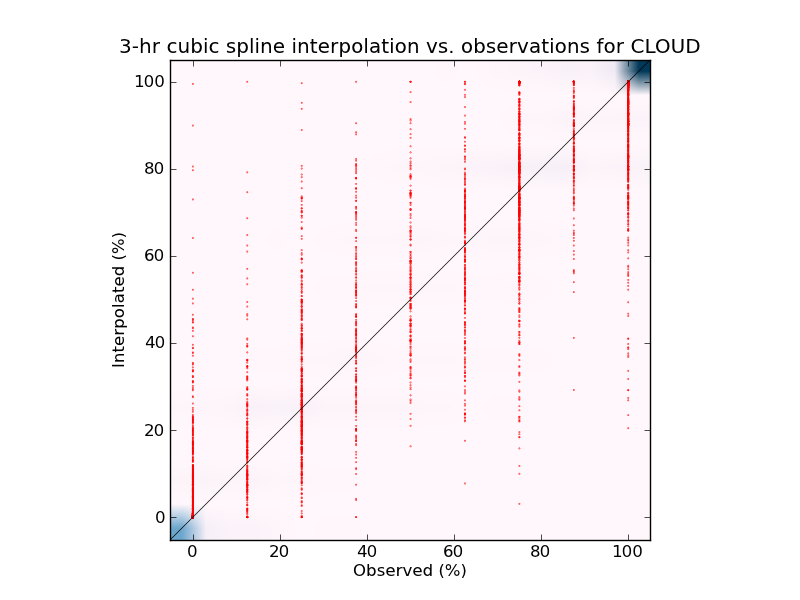
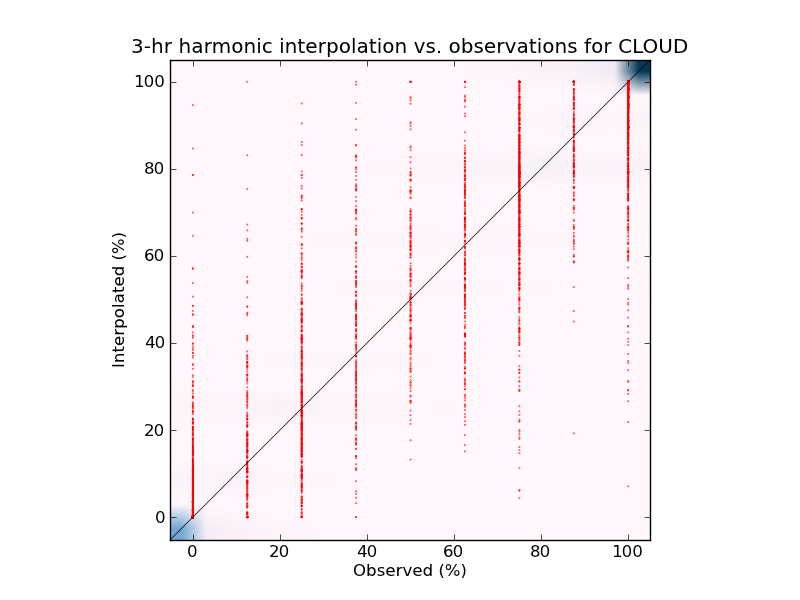
The North American Regional Reanalysis (NARR) combines high-resolution numerical weather prediction model output with assimilated observations. It therefore provides a best guess at the four-dimensional state of the atmosphere. NARR data are available at 32-km resolution every three hours from 1979 to the present. Effective use of these data in the construction of a continuous hourly time series of climatological data requires a temporal interpolation procedure. The plots below illustrate the results of three different temporal interpolation procedures. Three options for the temporal interpolation procedure include a local harmonic analysis, cubic spline interpolation, and a simple linear interpolation. The local harmonic analysis creates a perfect harmonic fit to seven NARR data points. The interpolated values for the two hours immediately preceding the middle NARR data point then fall on the resulting harmonic curve. The cubic spline interpolation creates a fit between seven NARR data points as well. The linear interpolation simply fits a straight line between adjacent NARR data points to create an estimate of hourly data between those points. Hourly observations from the Asheville Regional Airport provide a way to test these three interpolation procedures. Interpolations between every third hour from 0000 UTC 1 January 1985 to 0000 UTC 1 January 1986 are compared here with the actual observations. Remarkably, there were no missing observations for the entire year. The scatterplots below compare the actual observations with the interpolated values. Since each interpolation procedure matches the three-hourly data exactly, the plots exclude those values. An underlying heat map indicates the frequency of a particular estimate–observation pair. Right-click on any image to see a full-size version. You may also wish to view some scalar accuracy measures. |
| Air Temperature |
 |
| Dewpoint Temperature |
 |
| Wind Speed |
 |
| East-West Component of Wind Speed |
 |
| North-South Component of Wind Speed |

 |
| Cloud Cover |
 |