Raster GraphicsIntroductionRaster images (see Raster Graphics) contain an array of pixels, each with an individual color assignment composed of shades of red, green, and blue (RGB) for display on a computer monitor. A value between 0 and 255 (or 00 and FF in hexadecimal notation) determines the intensity of each of these three colors for a particular pixel. Visit this explanation of hexadecimal numbers and how we use them to describe colors. The appearance of a raster image is not independent of the size of the image. Zooming in on a raster image degrades the apparent quality of the image. Alternatively, vector graphics use points, lines, curves, and polygons to construct an image that can be scaled without degrading quality. Try zooming in as much as possible on the text in a PDF document drawn with vector graphics to understand this important difference. There are several formats for raster graphics. You may have seen many of the more common formats (e.g., JPEG, TIFF, GIF, PNG, Windows bitmap). Here, you will work with portable pixmap file format (PPM) files, since these are very easy to write with a simple program. PPM is one of three formats collectively know as Netpbm formats. After reading about Netpbm formats and studying the examples, you can learn more about using PPM to make high-quality color pictures. Writing PPM Files with Python
Grab first.py and make it executable with
chmod u+x first.py
Then run the program and view the result with
./first.py
Look at some of the text in first.ppm by using
head first.ppm Image Compression
Your small image is actually quite large when written with ASCII characters. View the size of the file with
ls -l first.ppm
You can also use ls -lh first.ppm to see the size in bytes and kilobytes.
Try changing the file type to binary (P6) in first.py to see how the size changes.
Now use ImageMagick to convert the PPM file to both a Portable Network Graphics (PNG) image and a Joint Photographic Experts Group (JPEG) image:
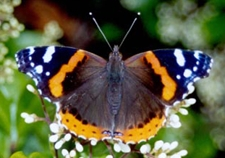
convert first.ppm first.png Raster image sizes can impact your selection of the appropriate format. Download redadmiral.jpg and then convert redadmiral.jpg redadmiral.png
The displayed images (above) appear identical, but the PNG image is 97 kilobytes and the JPEG image is 38 kilobytes. Fractional Vegetation CoverageAs a meteorologist, you may work with satellite observations at some point. You may want to visualize the data before manipulating them in a computer program or numerical weather prediction model. On Blizzard, grab fveg.tar using wget and then unpack the file with tar xvf fveg.tar in the directory where you plan to work. You now have several files:
The raw observations were obtained by the MODIS sensor onboard the Terra polar orbiting satellite. The Land Processes Distributed Active Archive Center provides the processed data at no charge. I have manipulated the data a bit to produce the text file provided here. The Python program should work straight out of the box: ./vegimg.py fvegMOD15A2.txt The program produces an image and a color bar in PPM format, both of which you can view using eog. Open a PPM file in a text editor to see the header before the binary RGB color information.
Inkscape and Image Formatting TipsThe free graphics editor Inkscape excels at creating and manipulating vector graphics, but it can also handle raster images. Start Inkscape and open your image file with inkscape vegimg.ppm & The & allows you to continue working on Blizzard. Ignore any error messages that may appear by hitting Enter in your SSH terminal. Add your color bar with File > Import... and browse to the location of the file. After importing, you may need to adjust the size of the color bar. Saving the file in Scalable Vector Graphics (SVG) format allows you to return later and manipulate your color bar and annotation. To save your work, try File > Save As... and enter the name of your file. Then select the folder in which to save the file by browsing through the folders. Do not underestimate the importance of the latter step. If you do not select the appropriate folder, Inkscape will crash. If you find that your Internet connection speed is just too slow to make working with Inkscape via Blizzard a viable option, then you may download Inkscape for free and use it locally. Exporting the image file worked best for me using File > Export Bitmap... In the dialog box, you can select the bitmap size and then save the file as a PNG image. You can further manipulate the image using ImageMagick. At the command prompt, use convert -help|more to learn about the options for using this powerful image editor. You could also see the command line options for convert or visit this ImageMagick tutorial. |
|||||||||
 |
 |
 |
|
|


 Your job, detailed in the Python code, requires assigning appropriate colors to the vegetation fraction information (the default colors are probably not the best choice).
Then assign different colors to special values such as water, urban areas, and other types of non-vegetative land cover.
After you have produced a satisfactory color scheme, use
Your job, detailed in the Python code, requires assigning appropriate colors to the vegetation fraction information (the default colors are probably not the best choice).
Then assign different colors to special values such as water, urban areas, and other types of non-vegetative land cover.
After you have produced a satisfactory color scheme, use 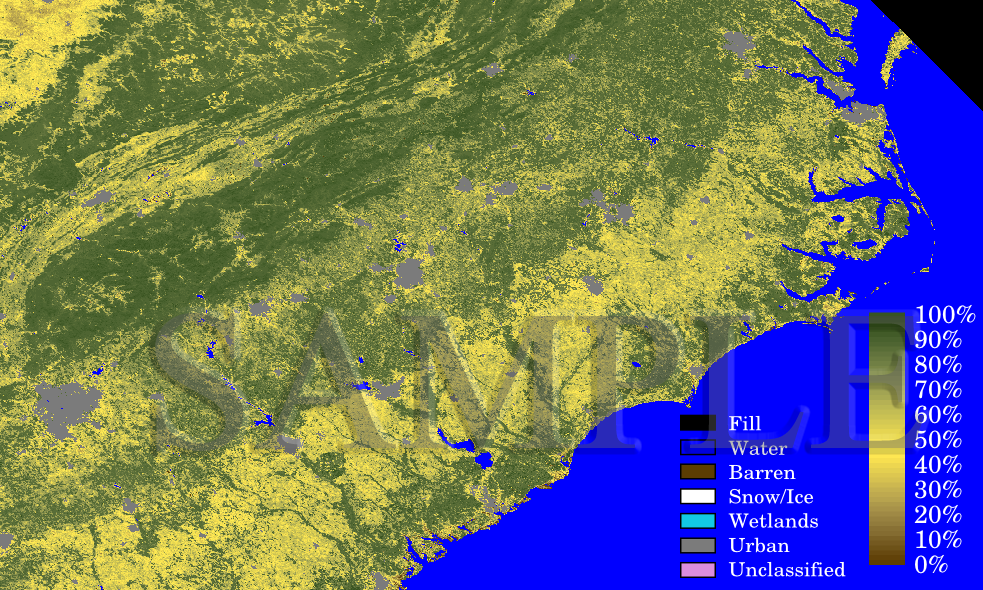
| North Carolina's Public Liberal Arts University |