GrADSImportant NoteGrADS is still very useful, but it's a little dated given the rise of Python within the atmospheric sciences. Therefore, this tutorial is no longer offered for credit. You are welcome to complete this tutorial for fun, but the MetPy tutorial will instead provide a more valuable experience. IntroductionAs an atmospheric scientist, you have a pretty good chance of running into the Grid Analysis and Display System (GrADS) at some point in your career. Other plotting programs exist (Python's matplotlib is particularly good and MetPy is fantastic for meteorological plots), but GrADS does a fair job of plotting contour and vector data on a base map and can also draw vertical cross sections, line and bar graphs, scatter plots, streamlines, grid boxes, station plots, and Hovmöller diagrams. In fact, GrADS drew the plot that you see on the left of this page. Visit the GrADS Home Page for a nice introduction to the plotting package, including lots of documentation. GrADS typically reads GRIB (gridded binary) data, but it also handles other common meteorological data formats such as NetCDF and HDF. In general, GrADS reads a data descriptor (or control) file that tells the program which binary data file to open, the initial time, and the coordinate setup; describes the variables; and provides a variety of other setup information. You can run GrADS directly from the command line, but fortunately there is also a GrADS scripting language (which varies a bit from the command line language) for more complicated sets of commands. NCEP Reanalysis DataFor this assignment, you will plot data from the NCEP/NCAR 40-Year Reanalysis Project (see the CISL Research Data Archive and these frequently asked questions for more information). Through the generous donations of several individuals, the UNCA Atmospheric Sciences department hosts the entire record of Reanalysis data from 1950—2016. For a nice example of the plotting capabilities of GrADS with the Reanalysis data, see my NCEP Reanalysis Plotter. GrADS From the Command Line
Make sure you have Xming running and then in a suitable directory on Blizzard, start GrADS with
grads
Just hit 'Enter' when it asks if you want landscape mode and then a blank window should pop up.
This is where your plots will appear.
Now open a descriptor file at the GrADS prompt and create a plot with
ga-> open /REANALYSIS/1974/ctl/at00z12z/hgt.prs
While this plot is interesting, you may want to zoom in on the United States.
First clear the old plot and then define the latitude and longitude limits:
ga-> c
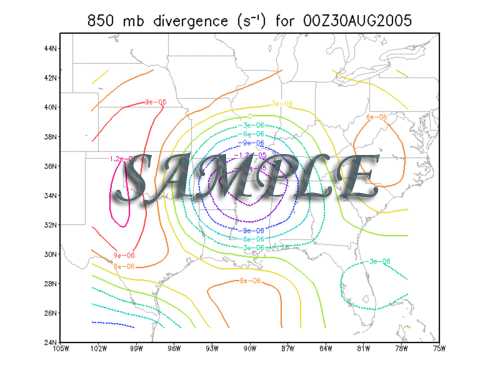
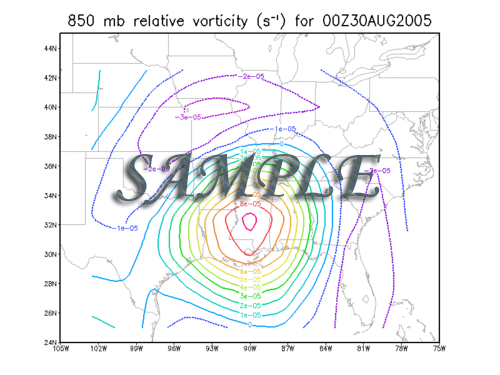
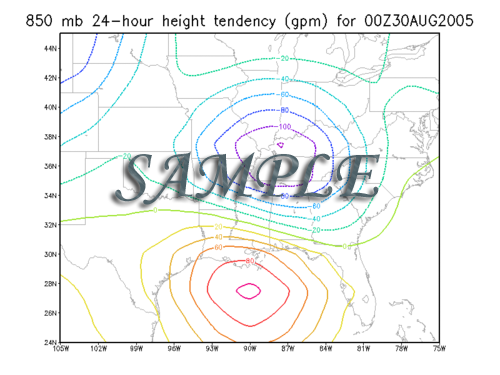
Create all four plots a) on a white background, b) centered on the area of interest, c) on a latitude-longtitude map projection, d) with an appropriate title including units, and e) on a high-resolution base map showing international borders and U.S. states. Your plots will look similar to the following figures.
Peruse the GrADS Documentation for helpful information and useful GrADS commands. The quick reference cards are particularly convenient. Please post your completed plots on your password-protected Web page, along with your modified GrADS script. |
 |
 |
 |
|
|


 Your job here is to create four different plots showing the 850-mb winds and heights around Hurricane Katrina.
Download
Your job here is to create four different plots showing the 850-mb winds and heights around Hurricane Katrina.
Download 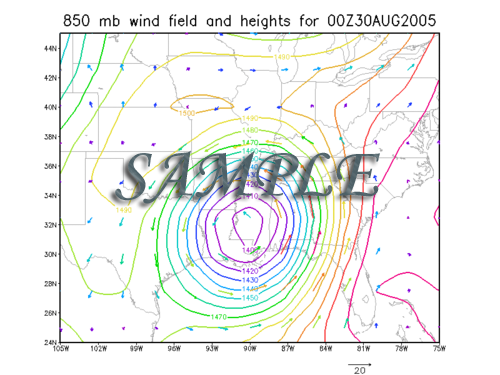
| North Carolina's Public Liberal Arts University |