|
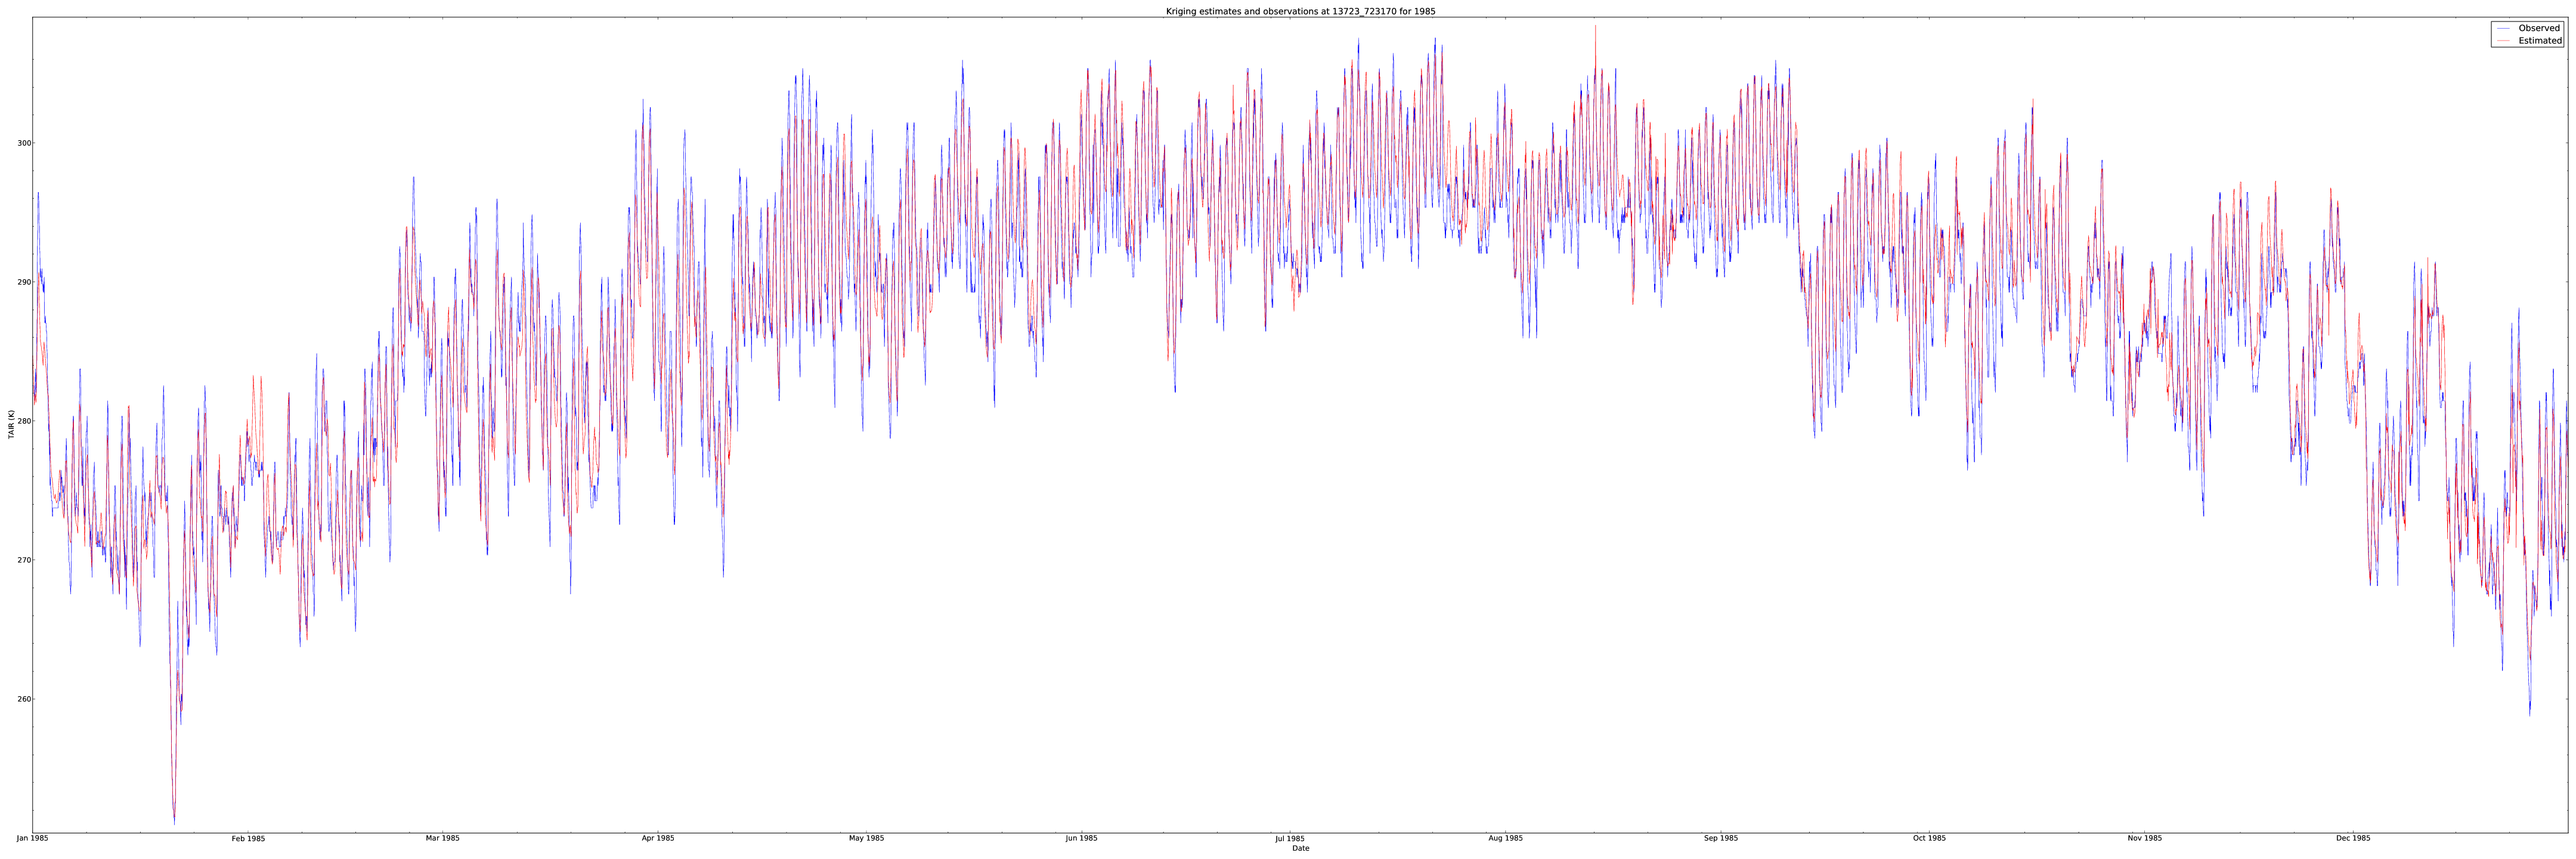
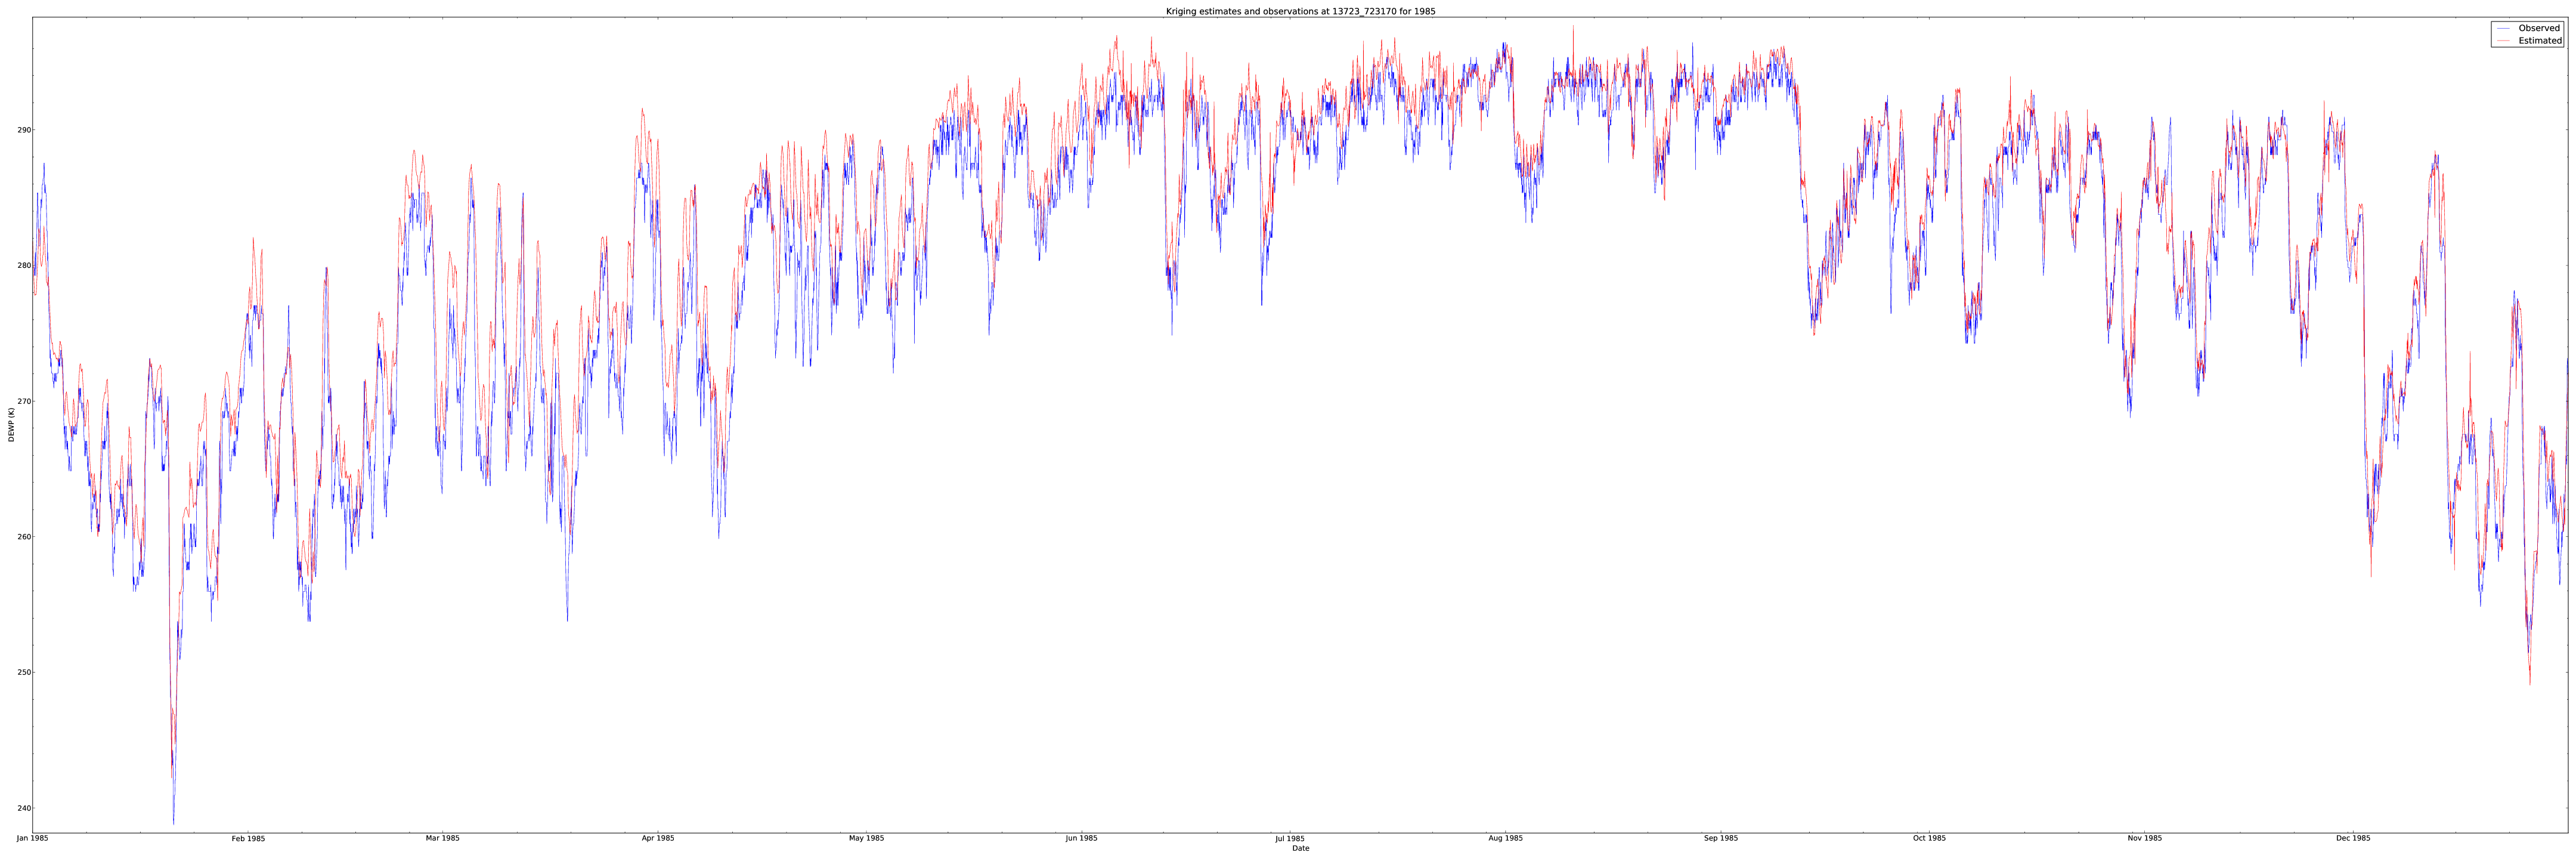
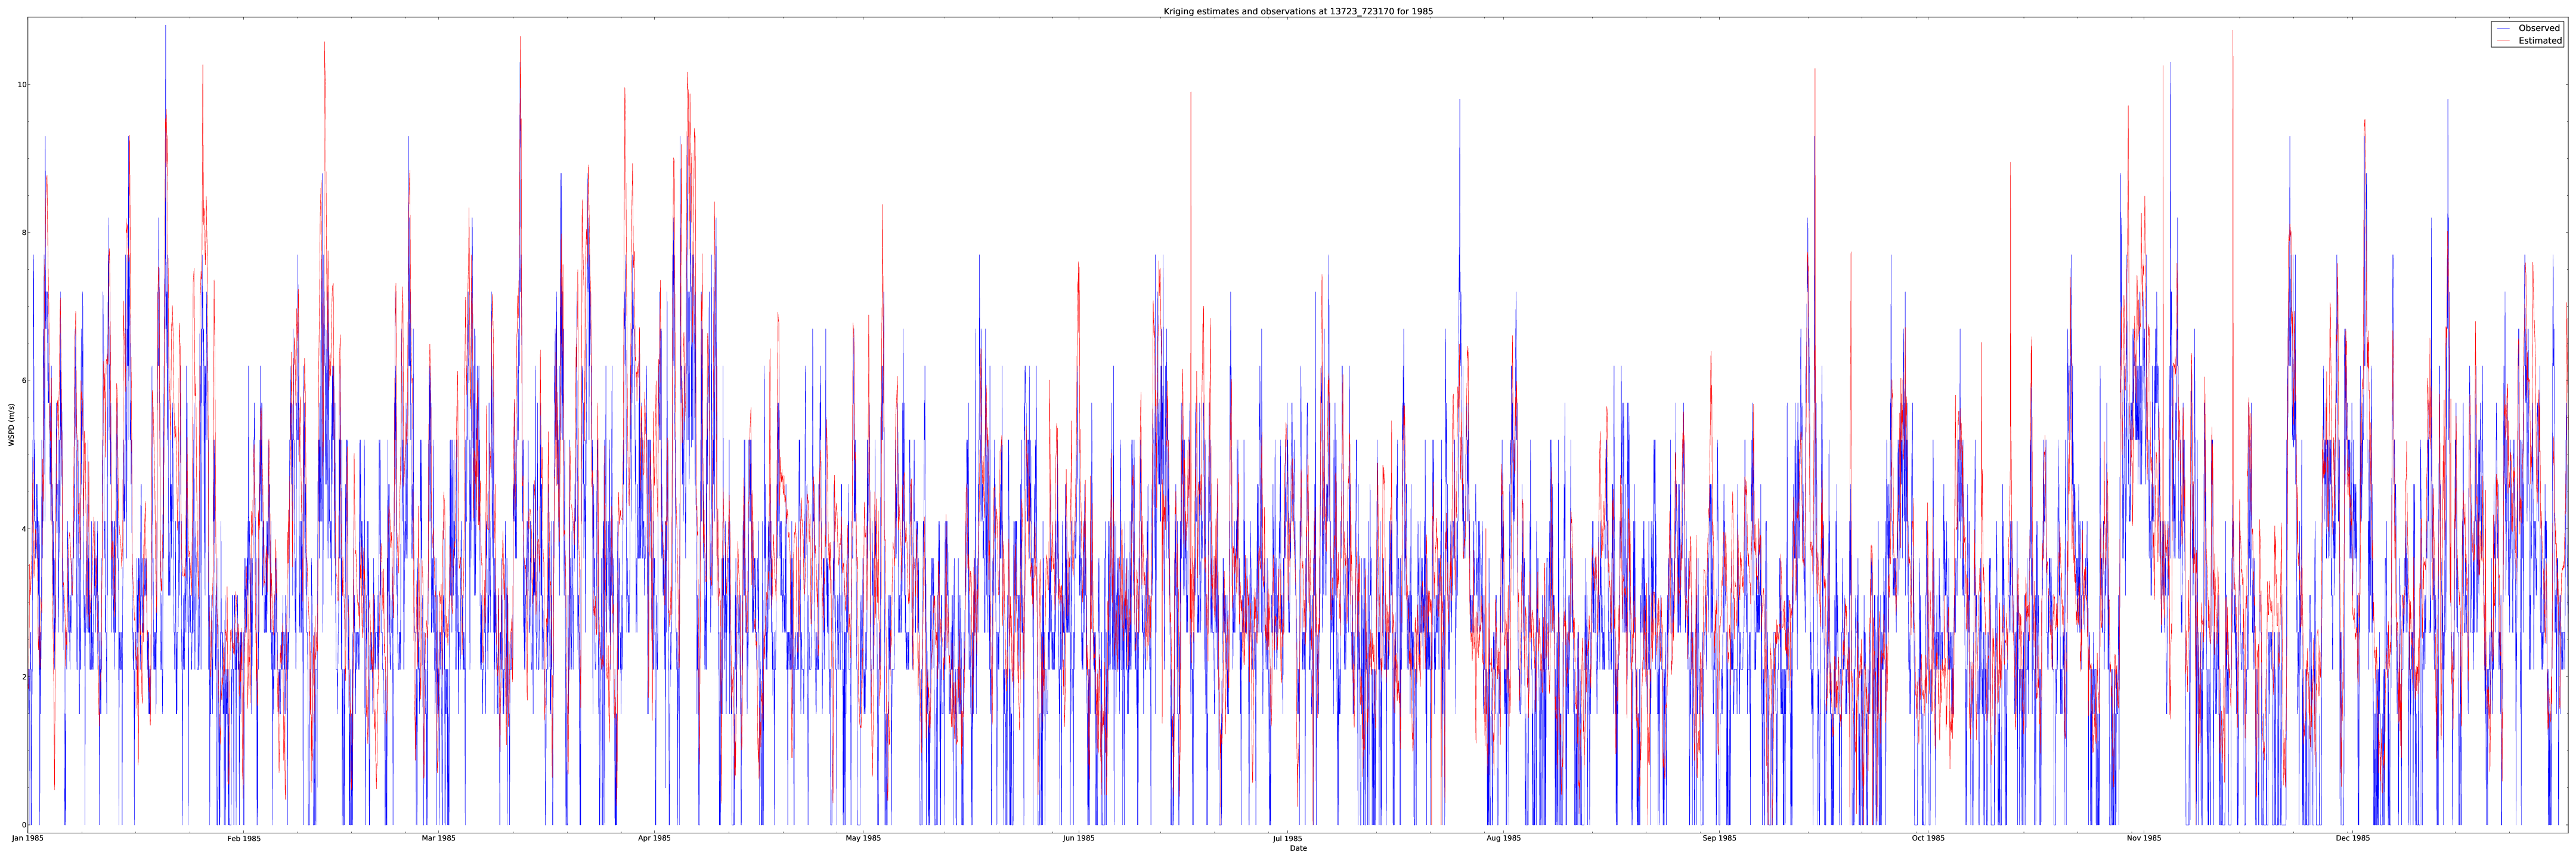
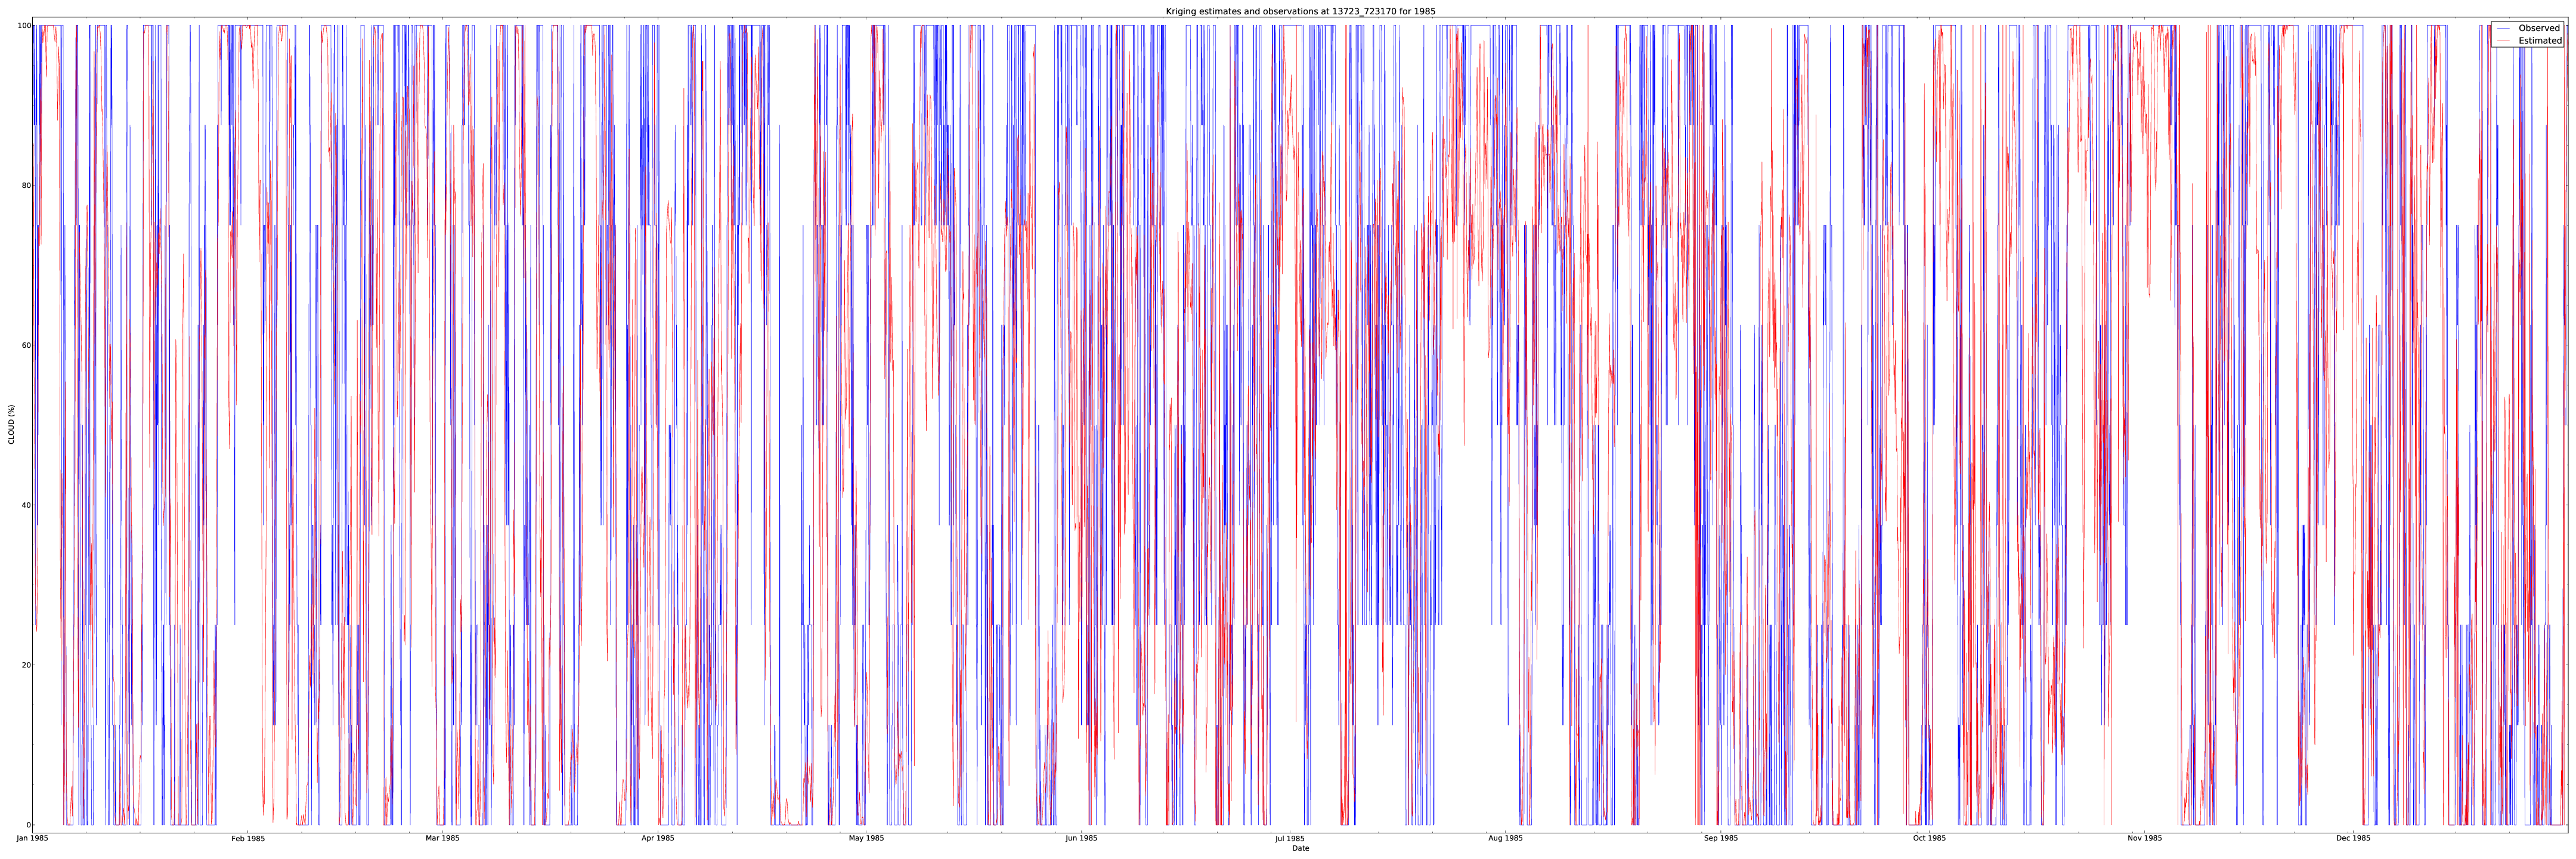
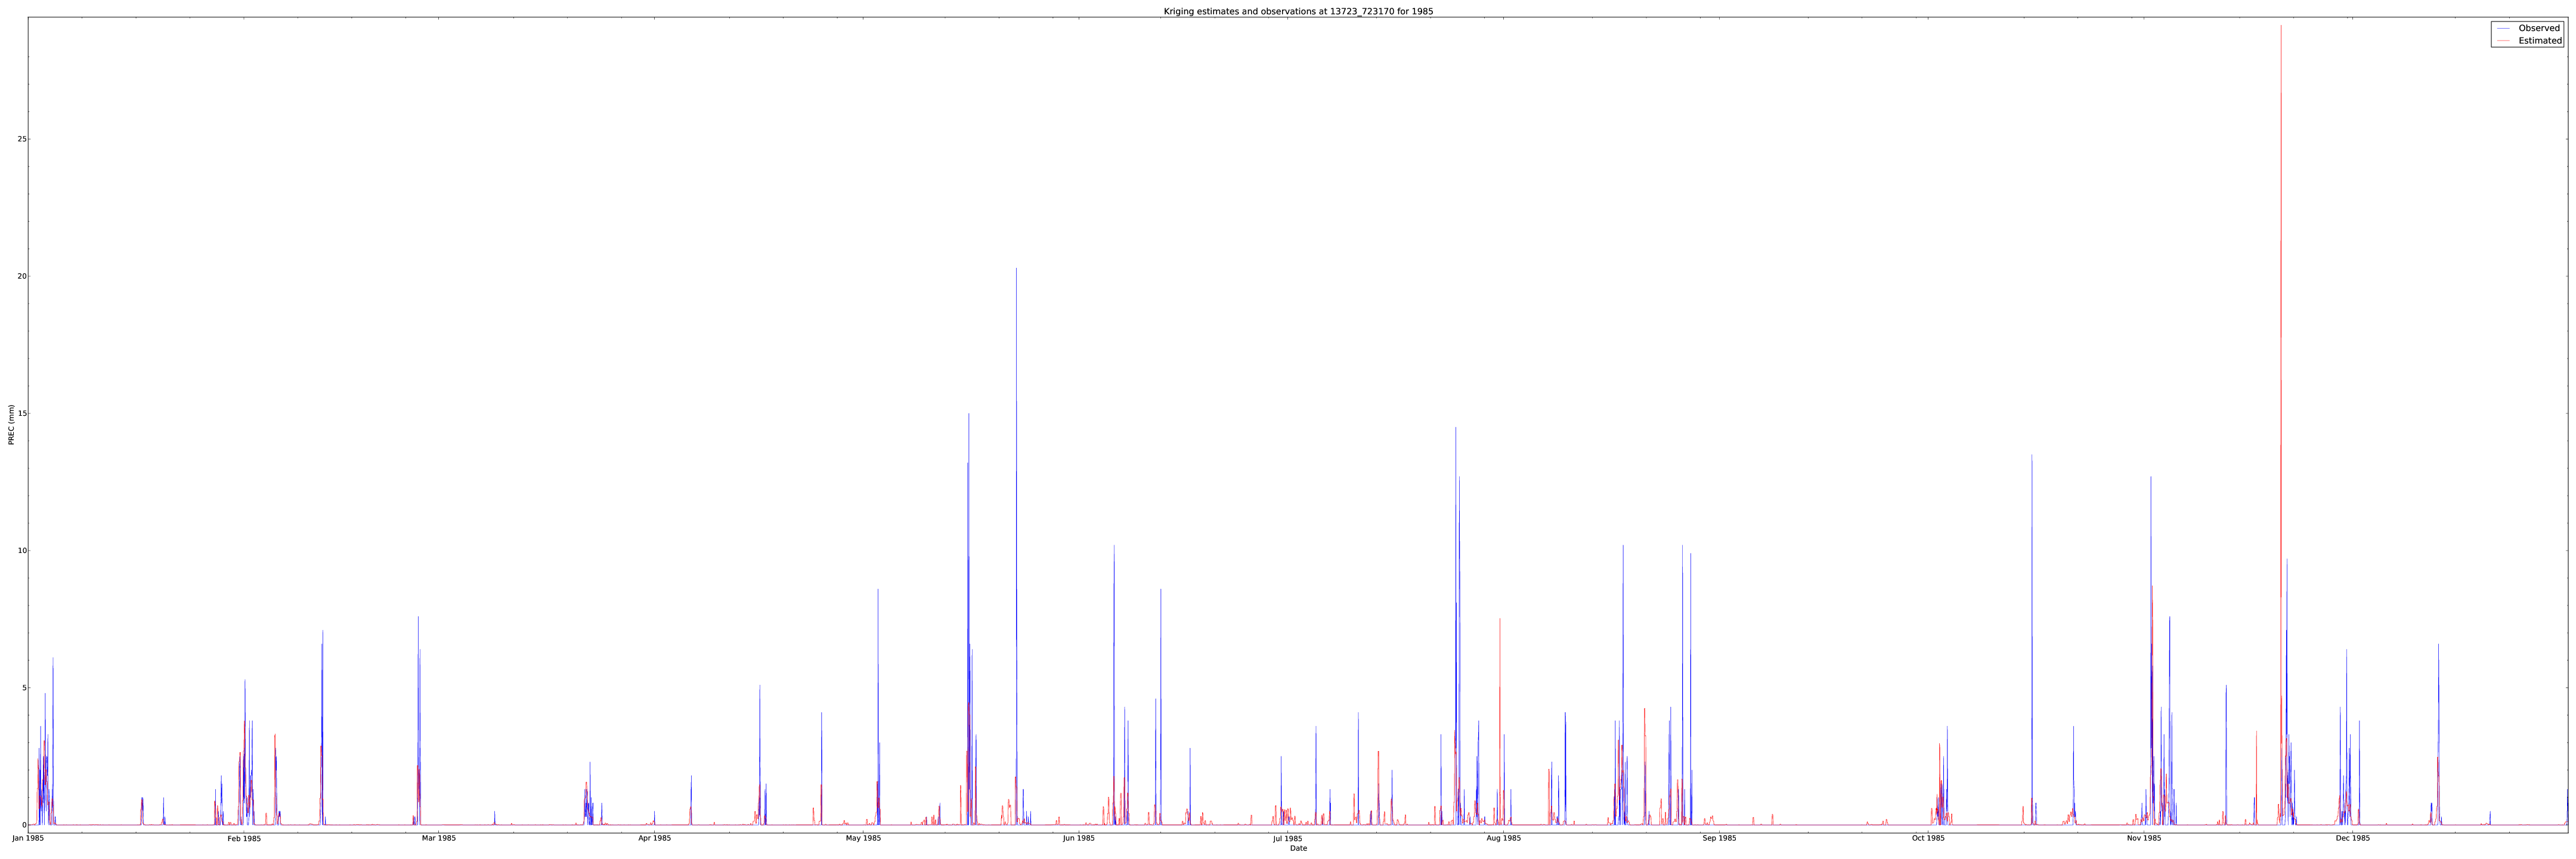
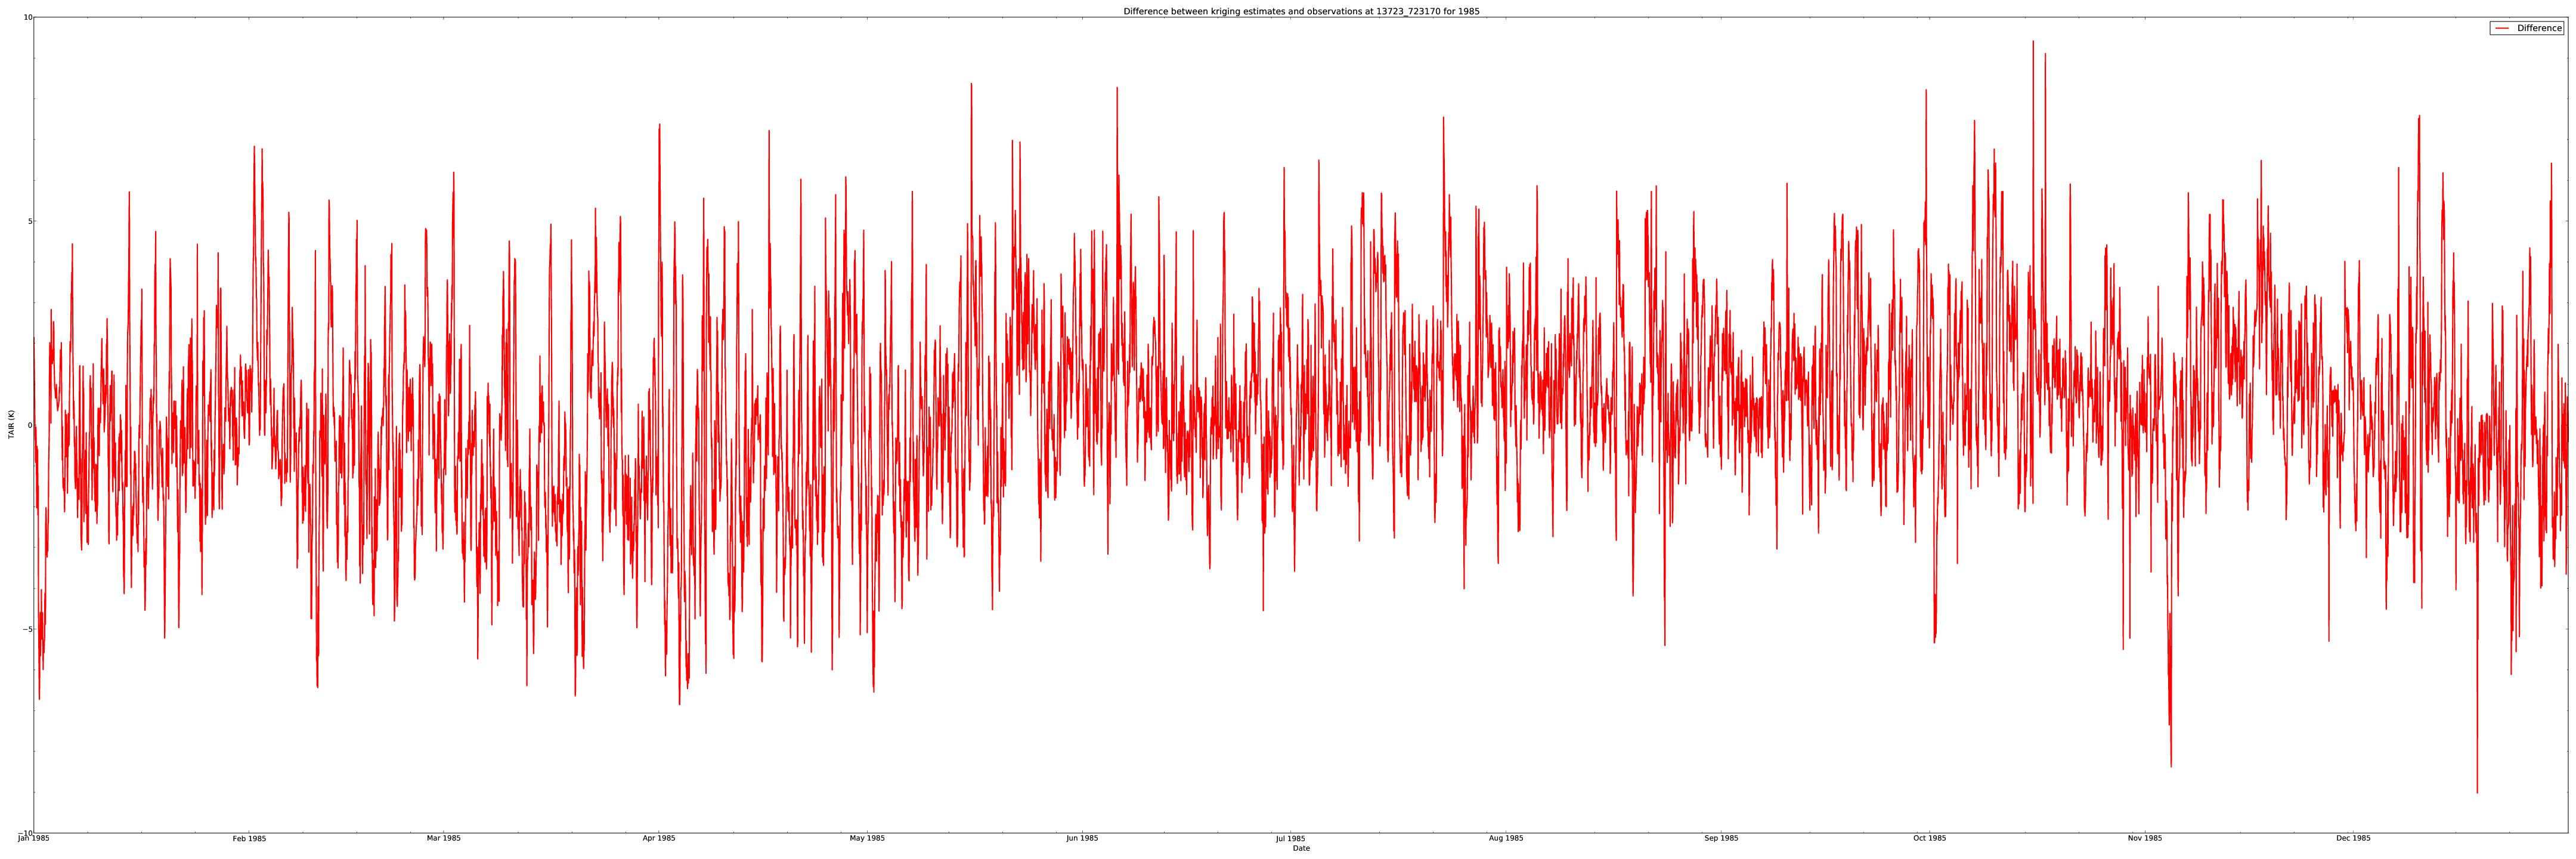
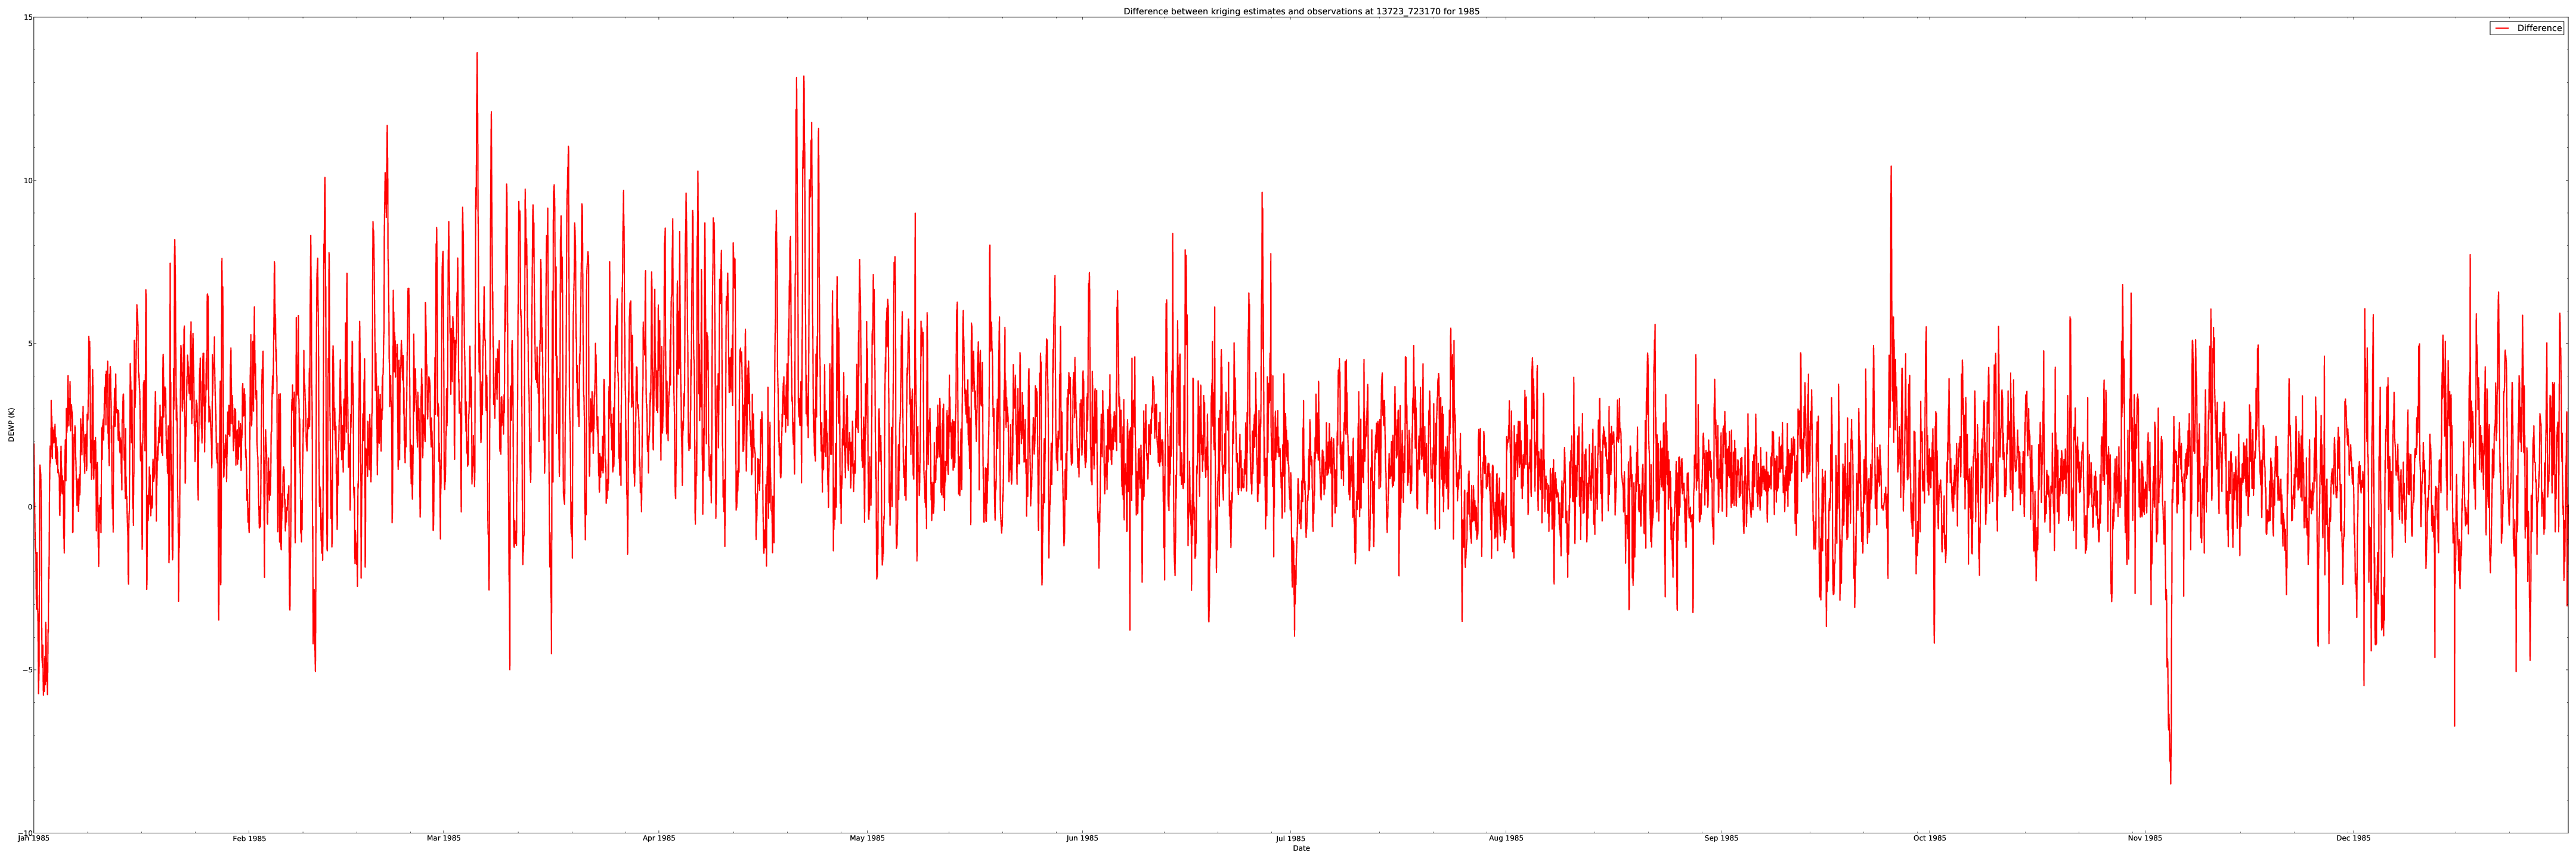
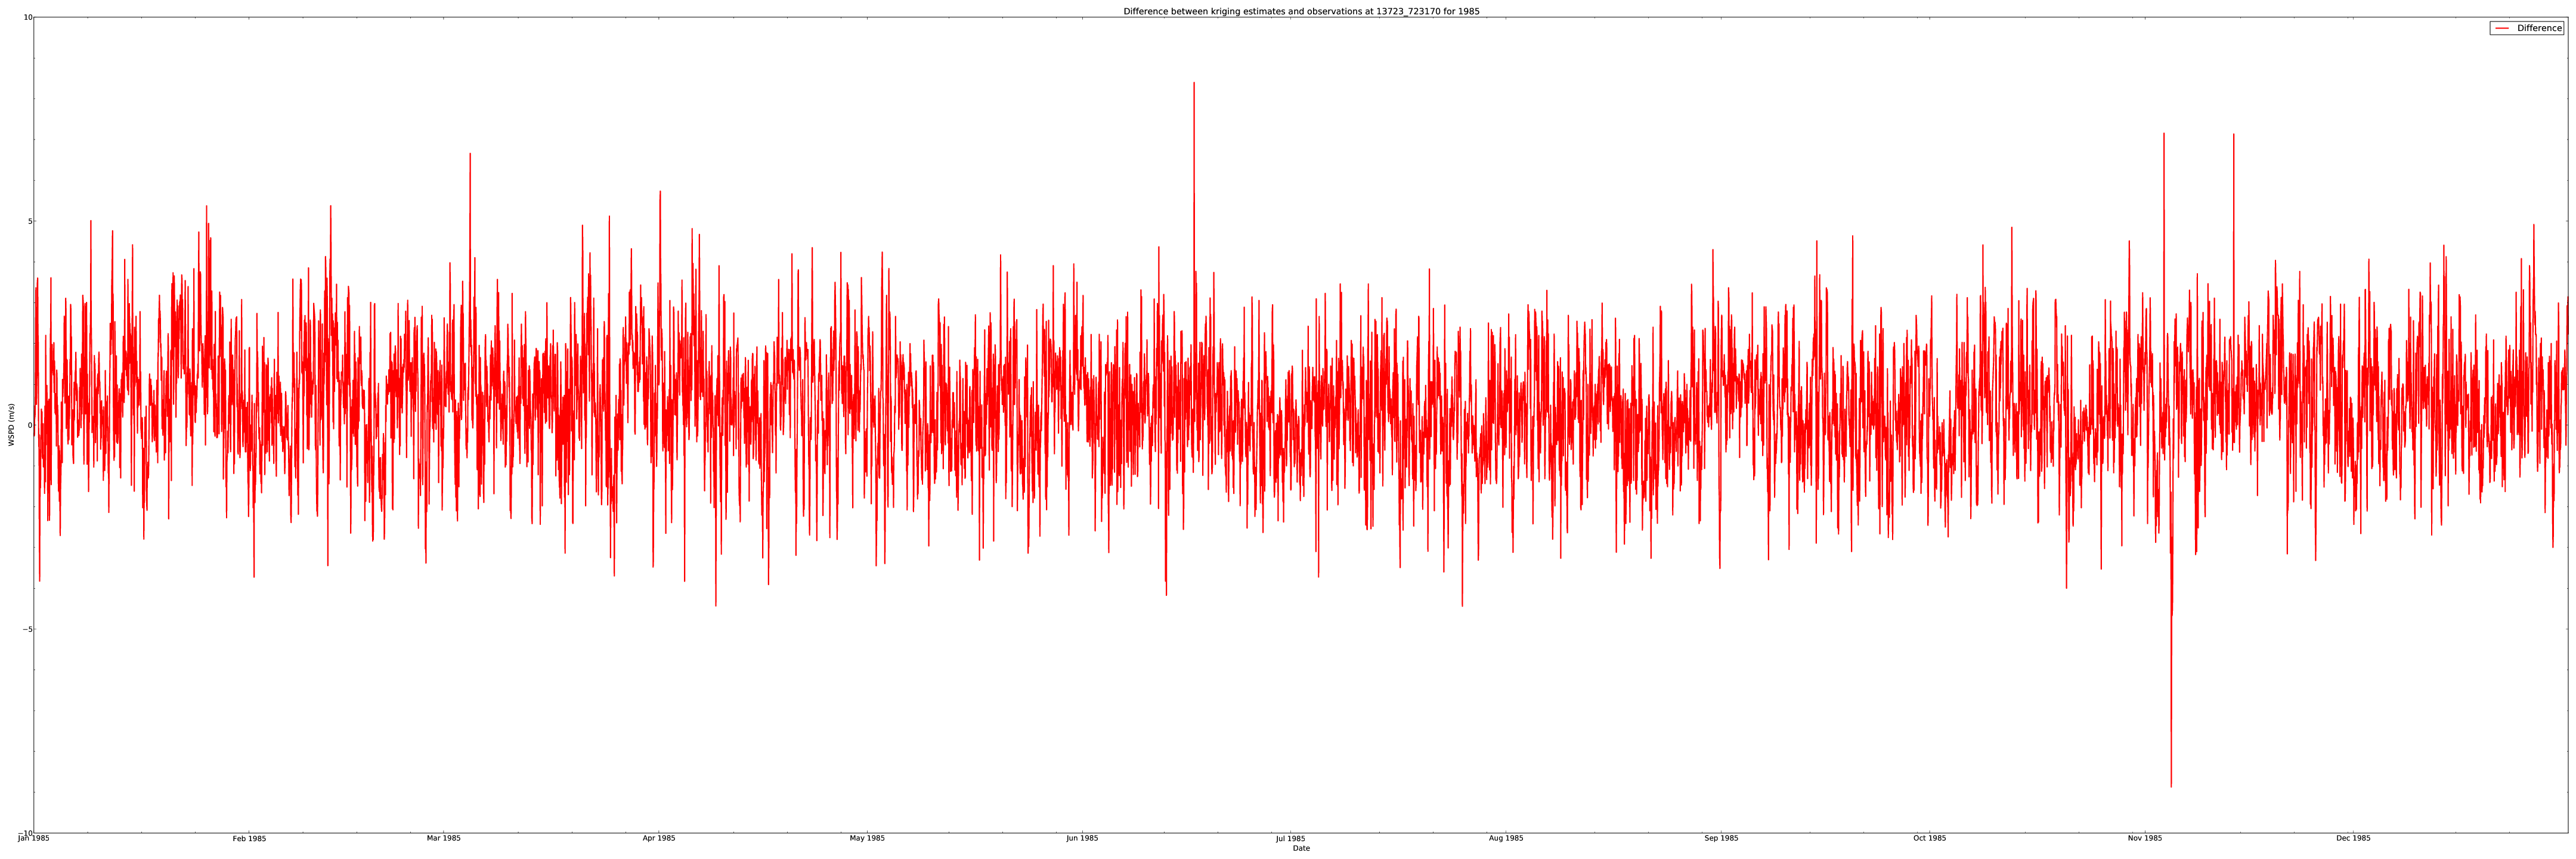
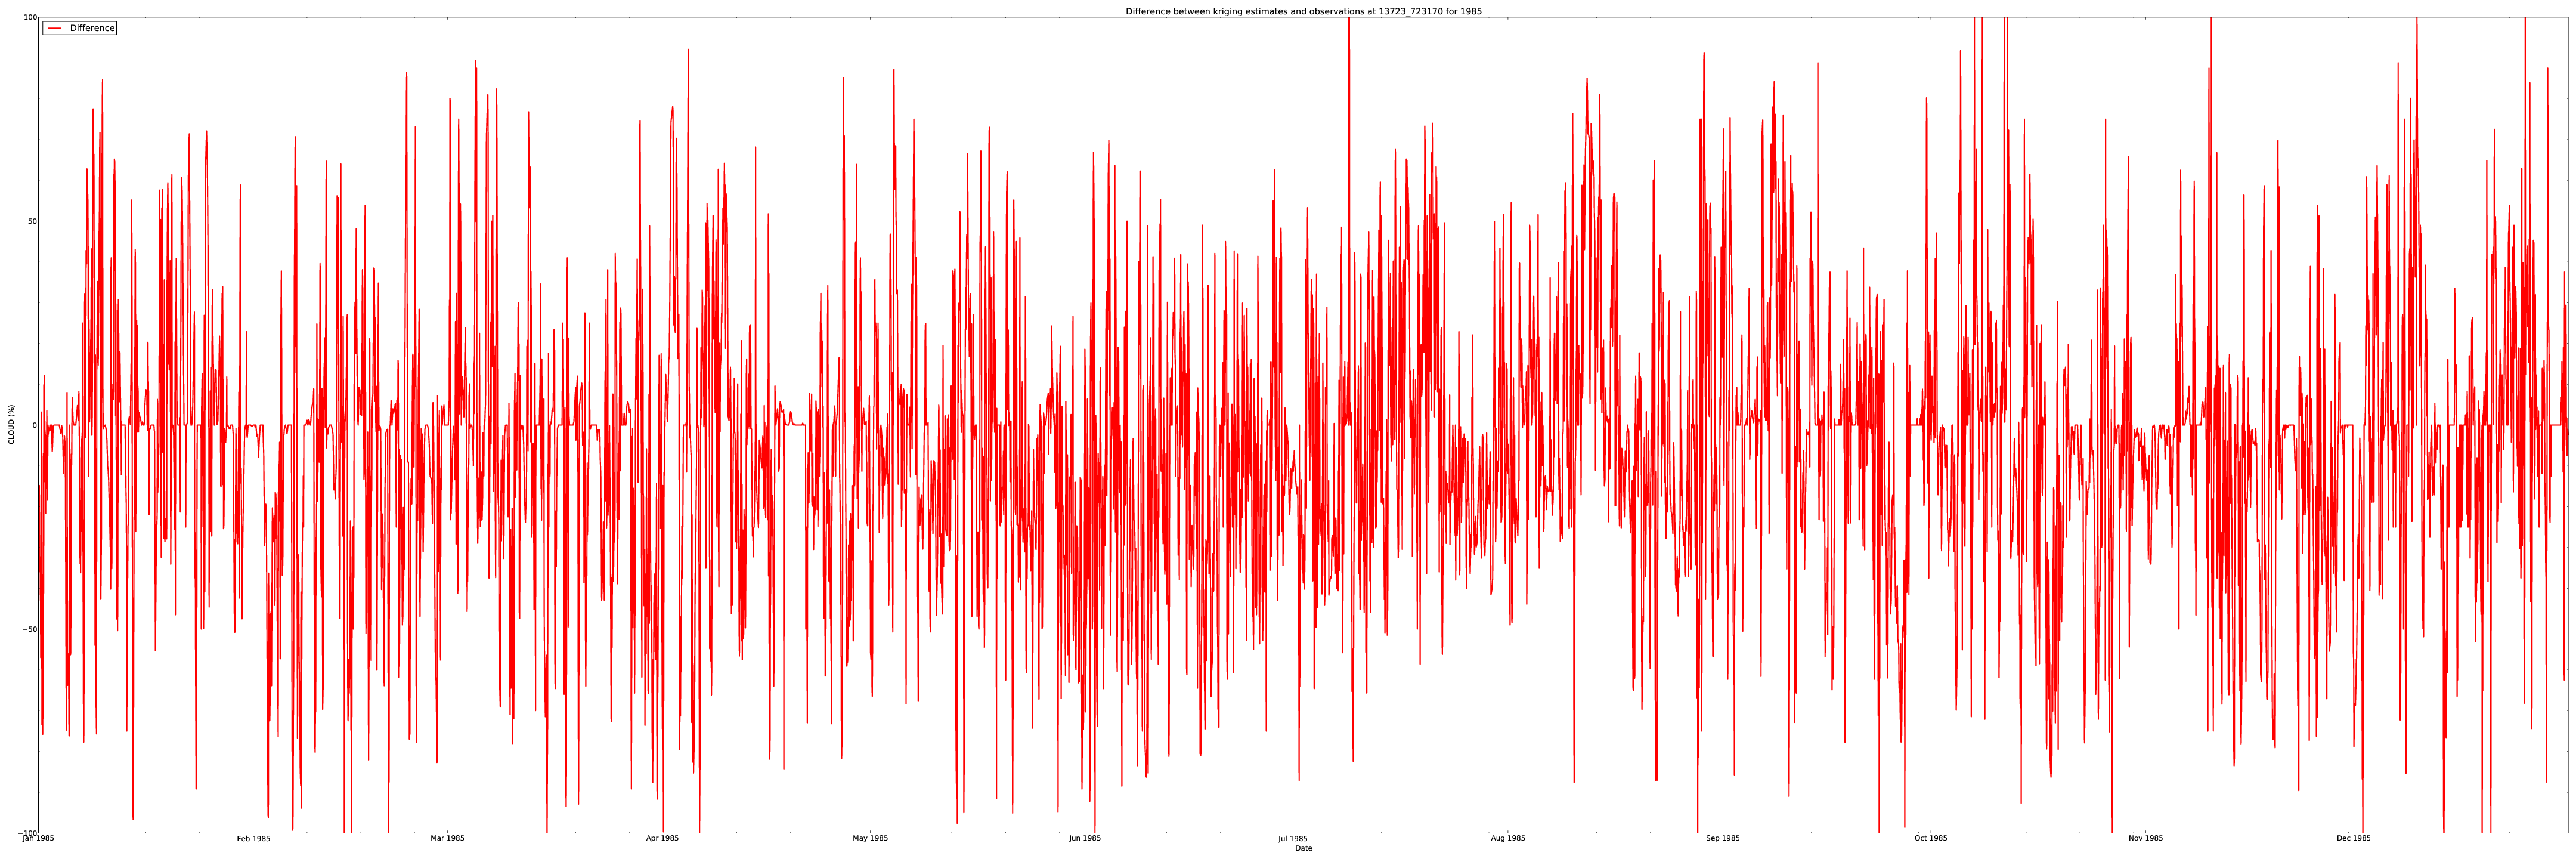
The following time series plots compare quality-controlled kriging estimates with hourly observations over the course of an entire year (1985) at the Piedmont Triad International Airport (GSO; station 13723_723170). Temperatures have been corrected according to nearby observed lapse rates derived from NARR data. Difference plots, defined as the estimate minus the observation, appear at the bottom. Cloud cover and precipitation are shown here for comparison, but please note that the final hourly values are not ultimately determined through interpolation techniques. Click on each image for a high-resolution PDF file or right-click and select "View Image" to see the full image. You could also go back to the main page.
|