Drop Size Distribution
September 8, 2001
Norman, Oklahoma
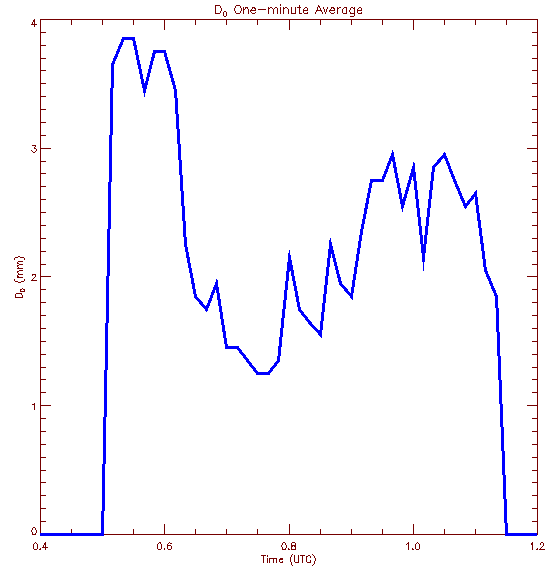
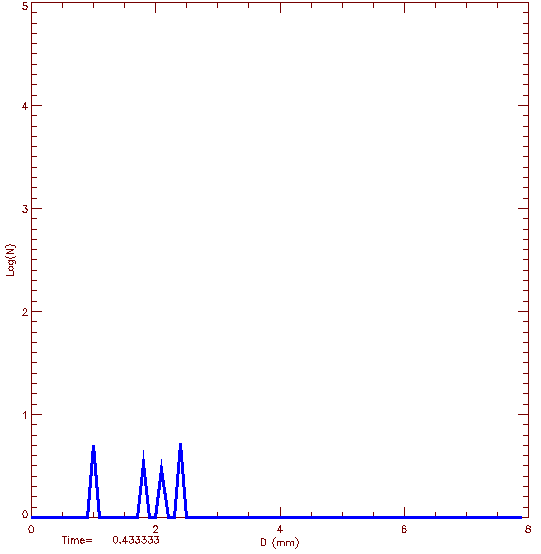
| The following loop of images shows the time evolution of the drop size distribution measured by the NSSL 2-D video disdrometer at one-minute intervals. The plot beneath shows the median volume diameter as a function of time. The plot at the bottom of the page shows the complete drop size distribution for the event, as well as rainrate derived from KTLX reflectivity, and median volume diameter and rainrate derived from the disdrometer. |
|
Frame Controls:
Loop Mode: Adjust Speed: Dwell First/Last: |
|