Drop Size Distribution
August 26, 2001
Norman, Oklahoma
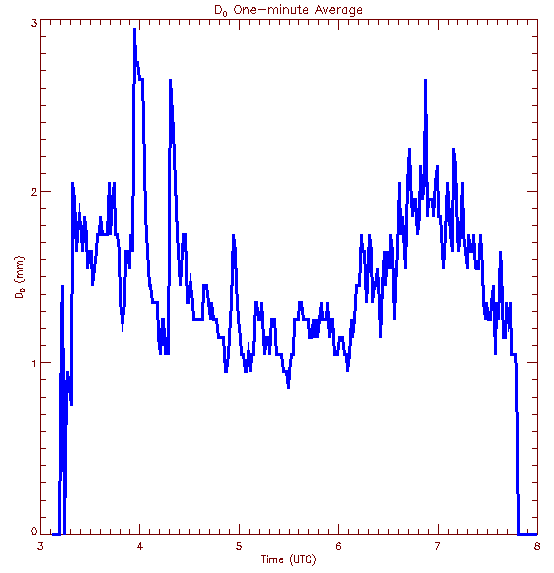
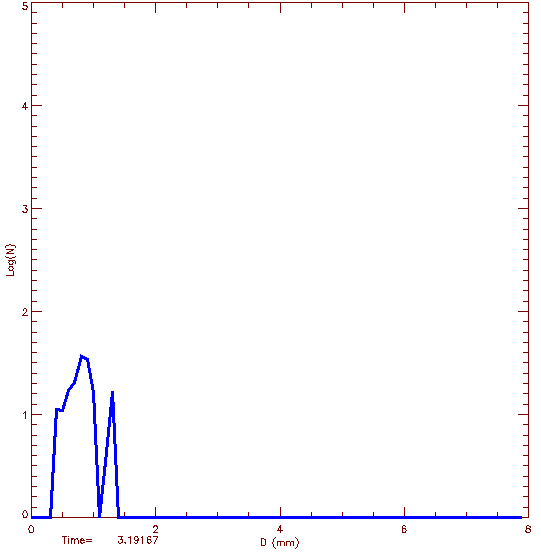
| The following loop of images shows the time evolution of the drop size distribution measured by the NSSL 2-D video disdrometer at one-minute intervals. The plot at the bottom of the page shows the median volume diameter as a function of time. |
|
Frame Controls:
Loop Mode: Adjust Speed: Dwell First/Last: |
|