We have data from five instruments for the case of September 8, 2001. A squall line
with 1 inch hail moved through Norman.
Click here for the
Cimarron radar loop of this storm.
The following plot shows rainfall rates from six sources:
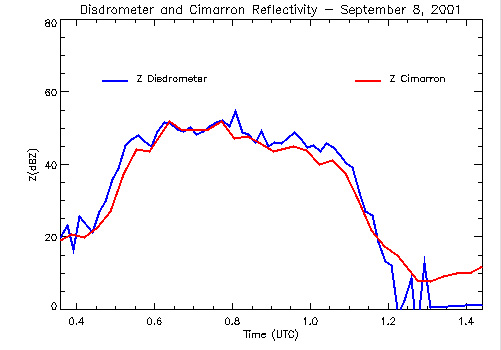
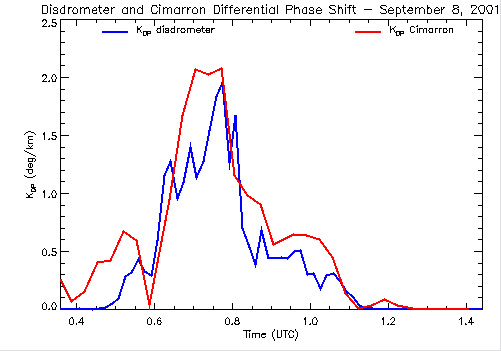
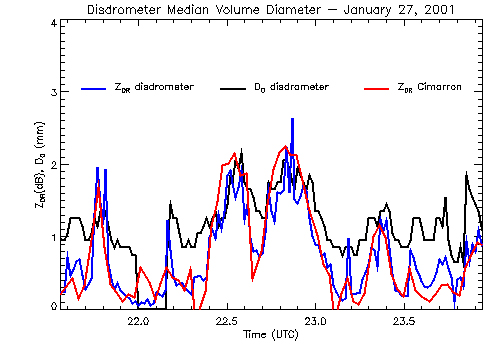
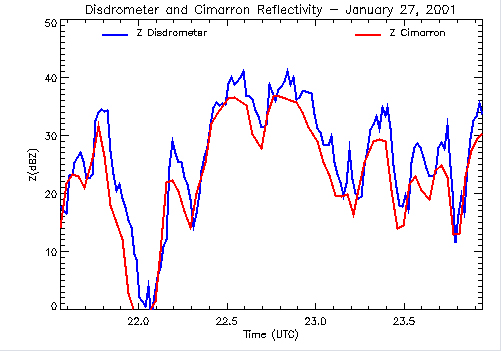
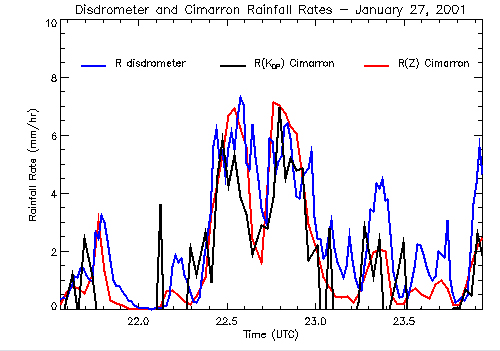
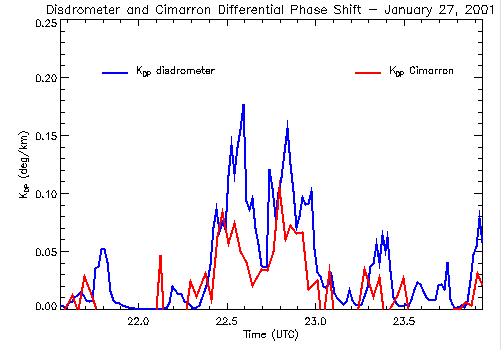
Here is the Cimarron vs. disdrometer comparison for this case:
Here are the four plots separately:
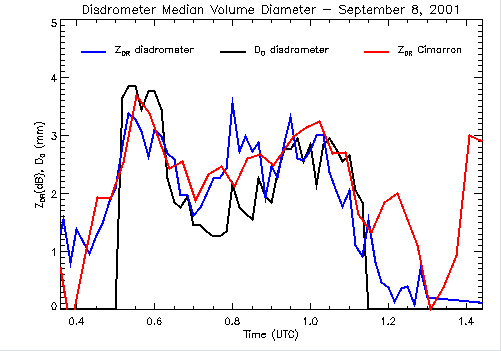
Here is the plot of drop size distribution with KTLX rainfall rate,
disdrometer rainfall rate, and median volume diameter for September 8, 2001.
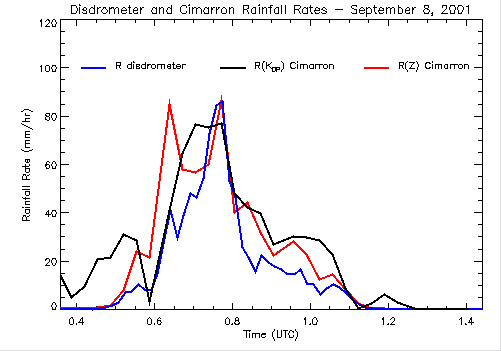
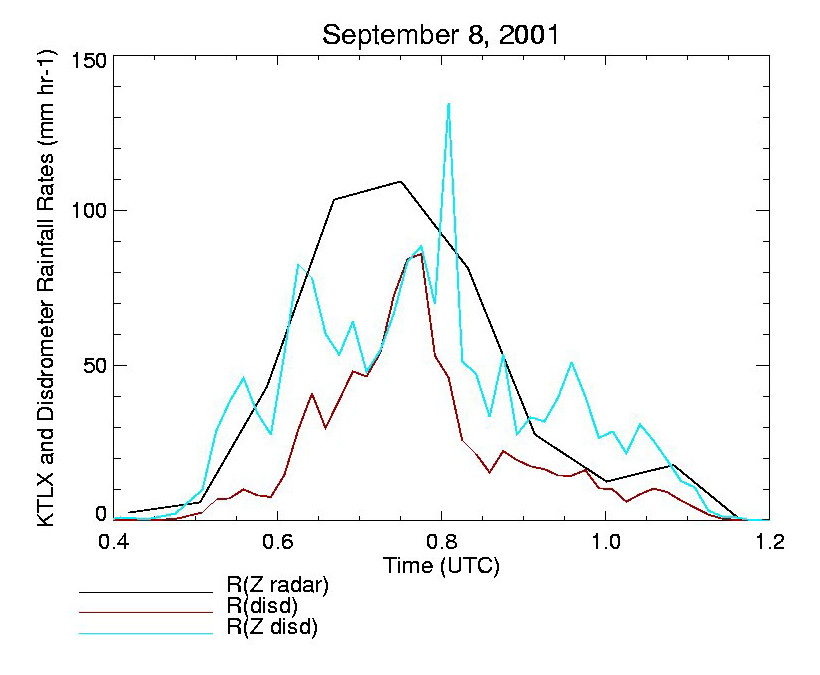
Here is the September 8, 2001 plot of measured disdrometer rainfall rate,
R(Z) from KTLX and rainfall rate from reflectivity derived from the disdrometer.
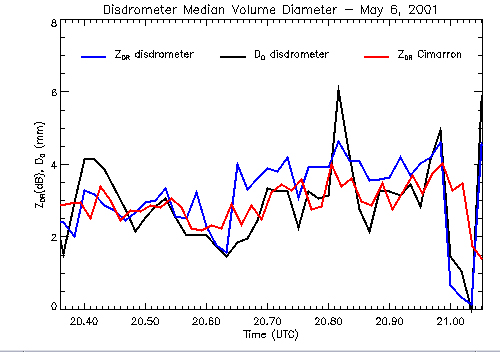
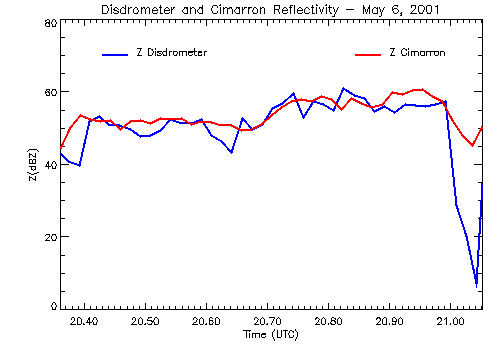
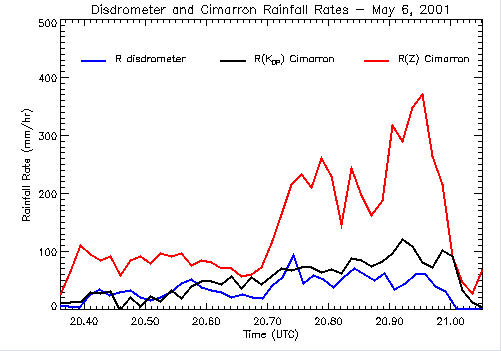
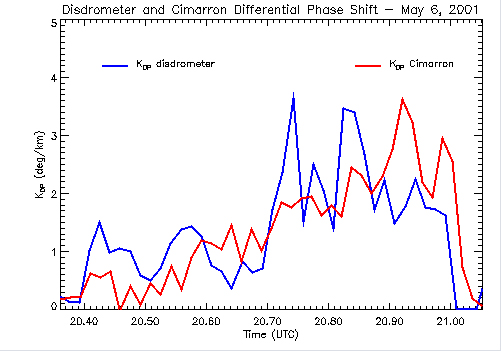
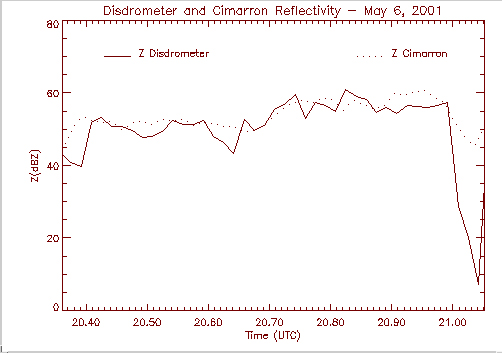
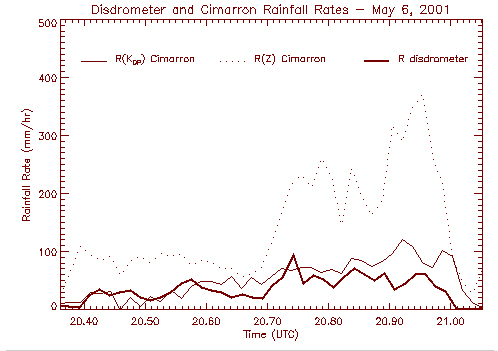
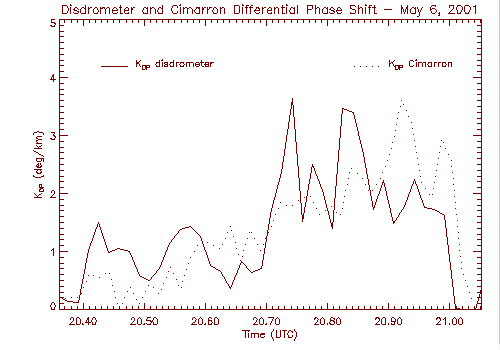
Another great case is May 6, 2001:
Click here for the Cimarron radar loop of this storm
The above image is split up into four images below:
Here is the same plot for May 6, 2001 as above, but in black and white:
Here are the four plots separately:
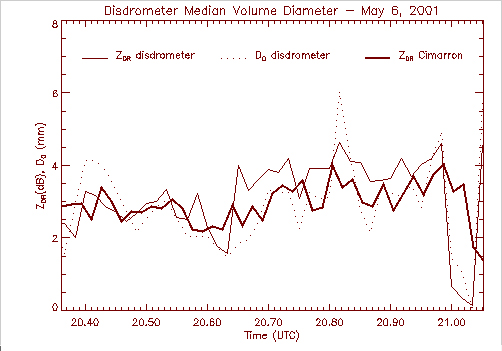
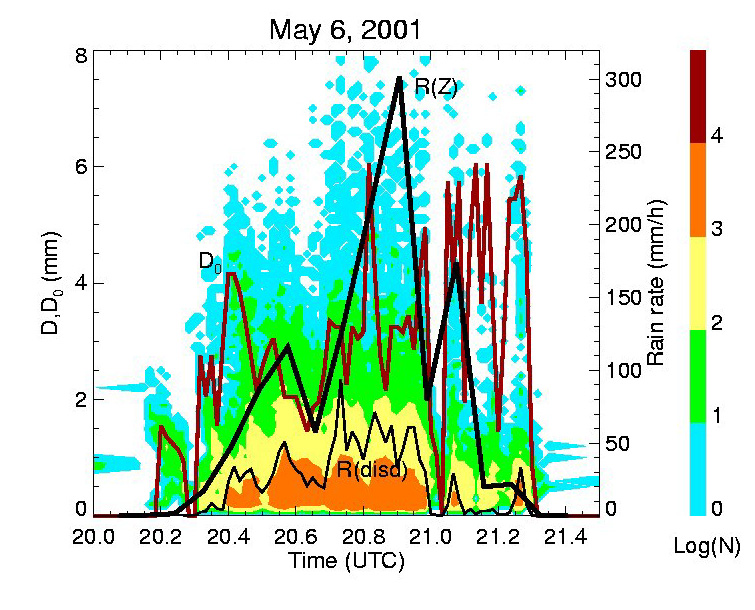
Here is the plot of drop size distribution with KTLX rainfall rate,
disdrometer rainfall rate, and median volume diameter for May 6, 2001.
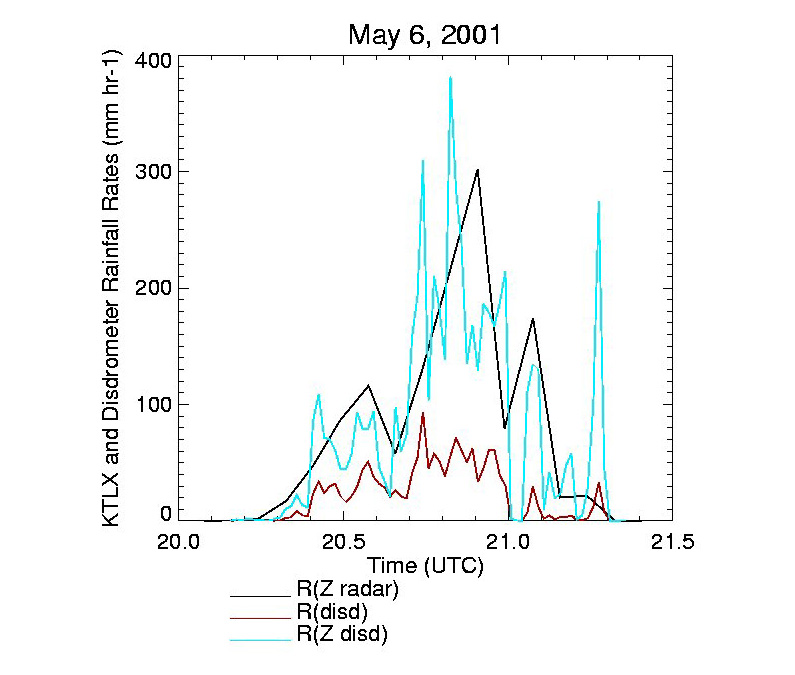
Here is the May 6, 2001 plot of measured disdrometer rainfall rate,
R(Z) from KTLX and rainfall rate from reflectivity derived from the disdrometer.
Now for some other plots for good measure
The above image is split up into four images below:
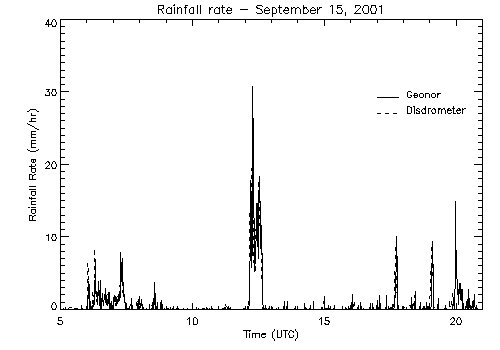
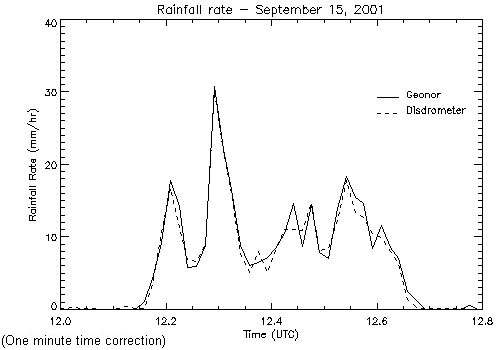
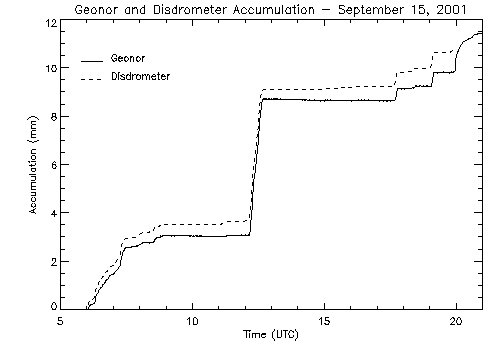
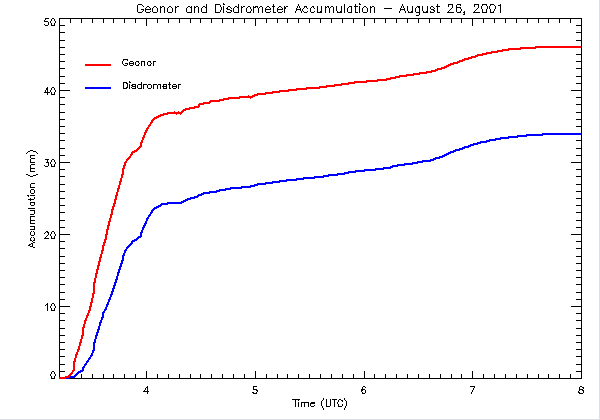
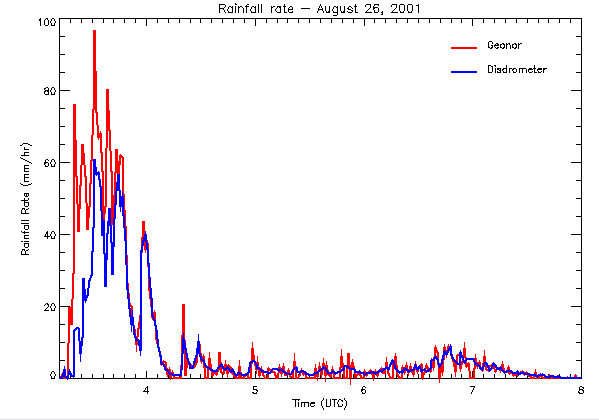
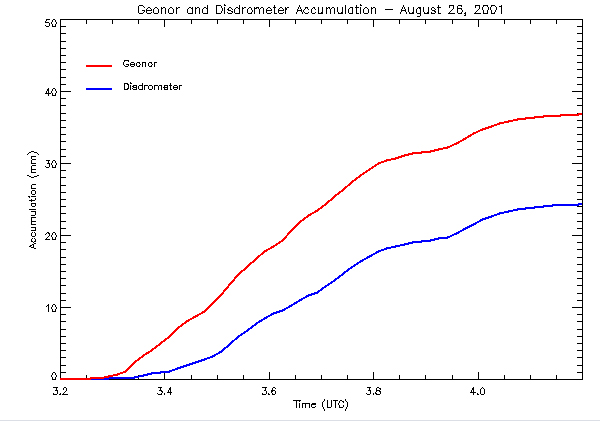
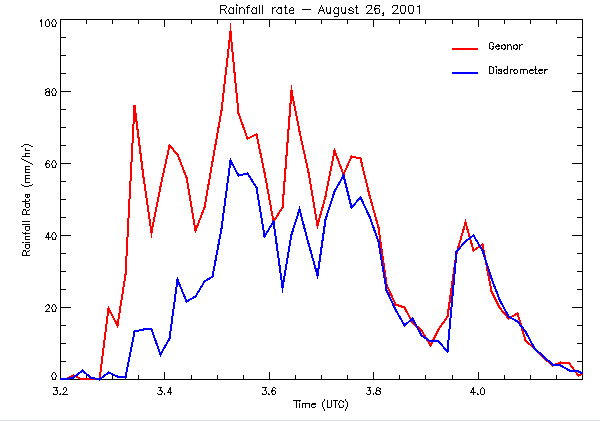
Here are some Geonor vs. disdrometer plots, first in color, then black and white:
And here are a couple of black and white plots: